Charts
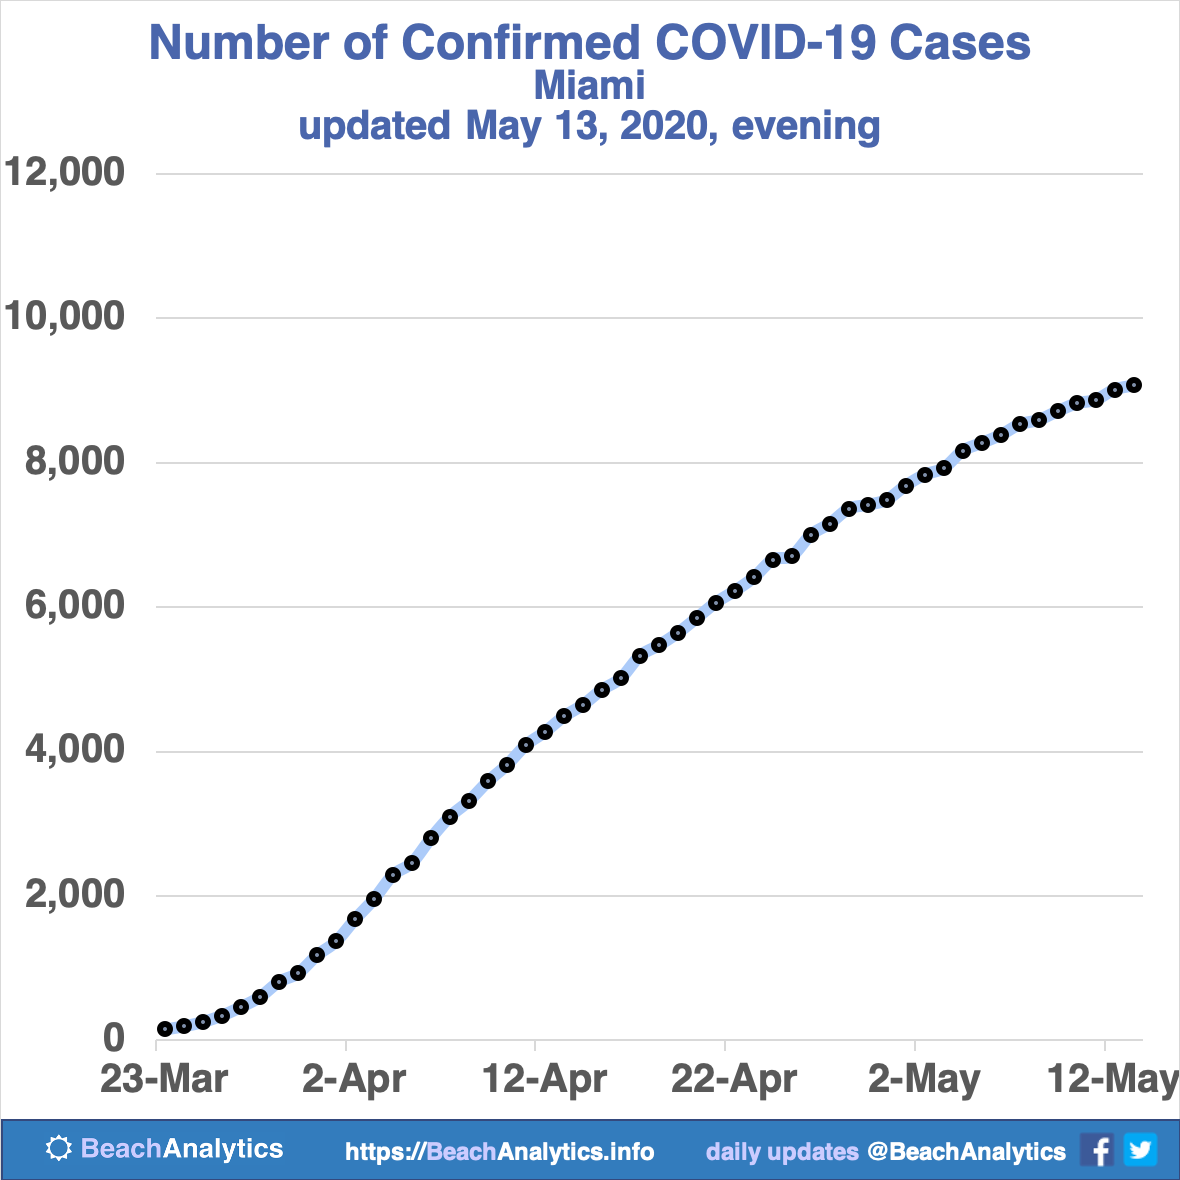
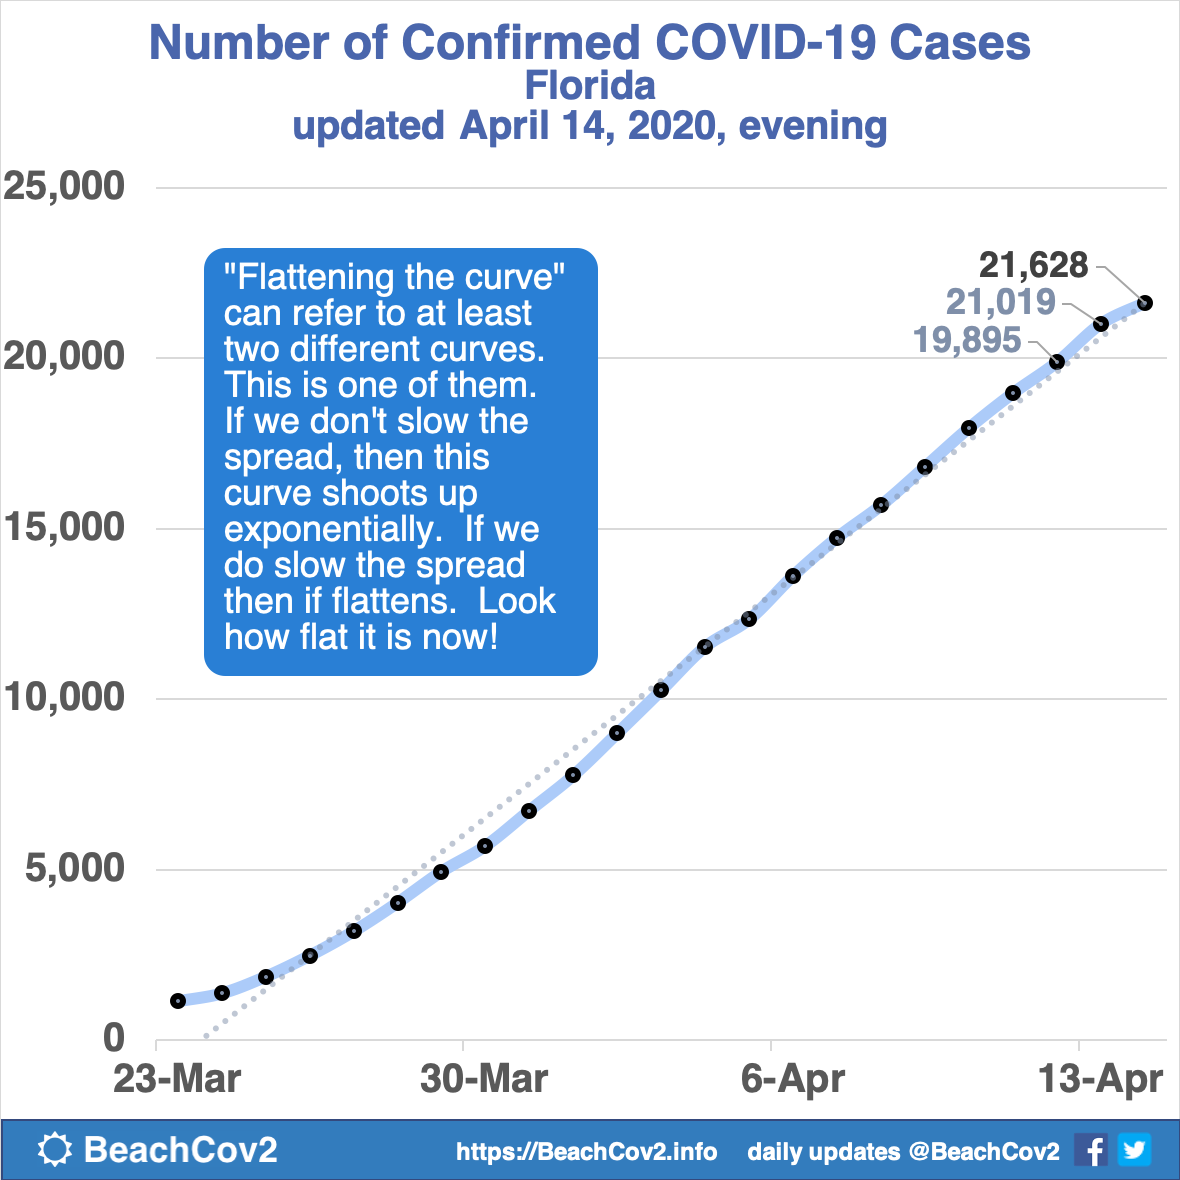
Confirmed COVID-19 Cases
This chart shows the number of confirmed cases over time. The confirmed case count data comes from the daily updates from the Florida Division of Emergency Management.
Please see the Confirmed COVID-19 Cases analysis product section for more information and archives of older versions.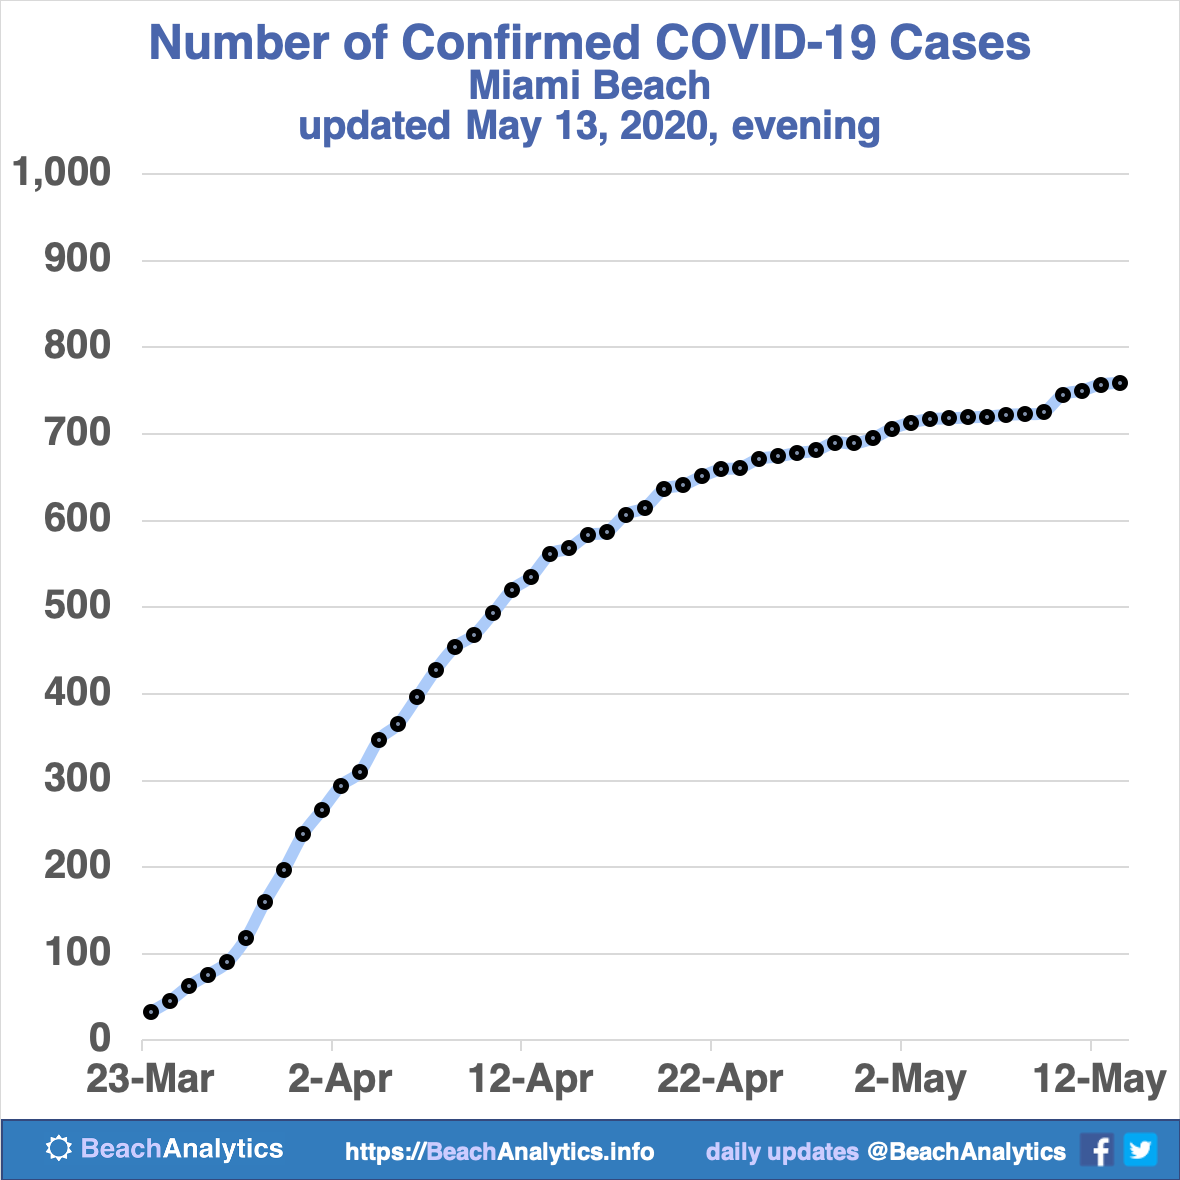
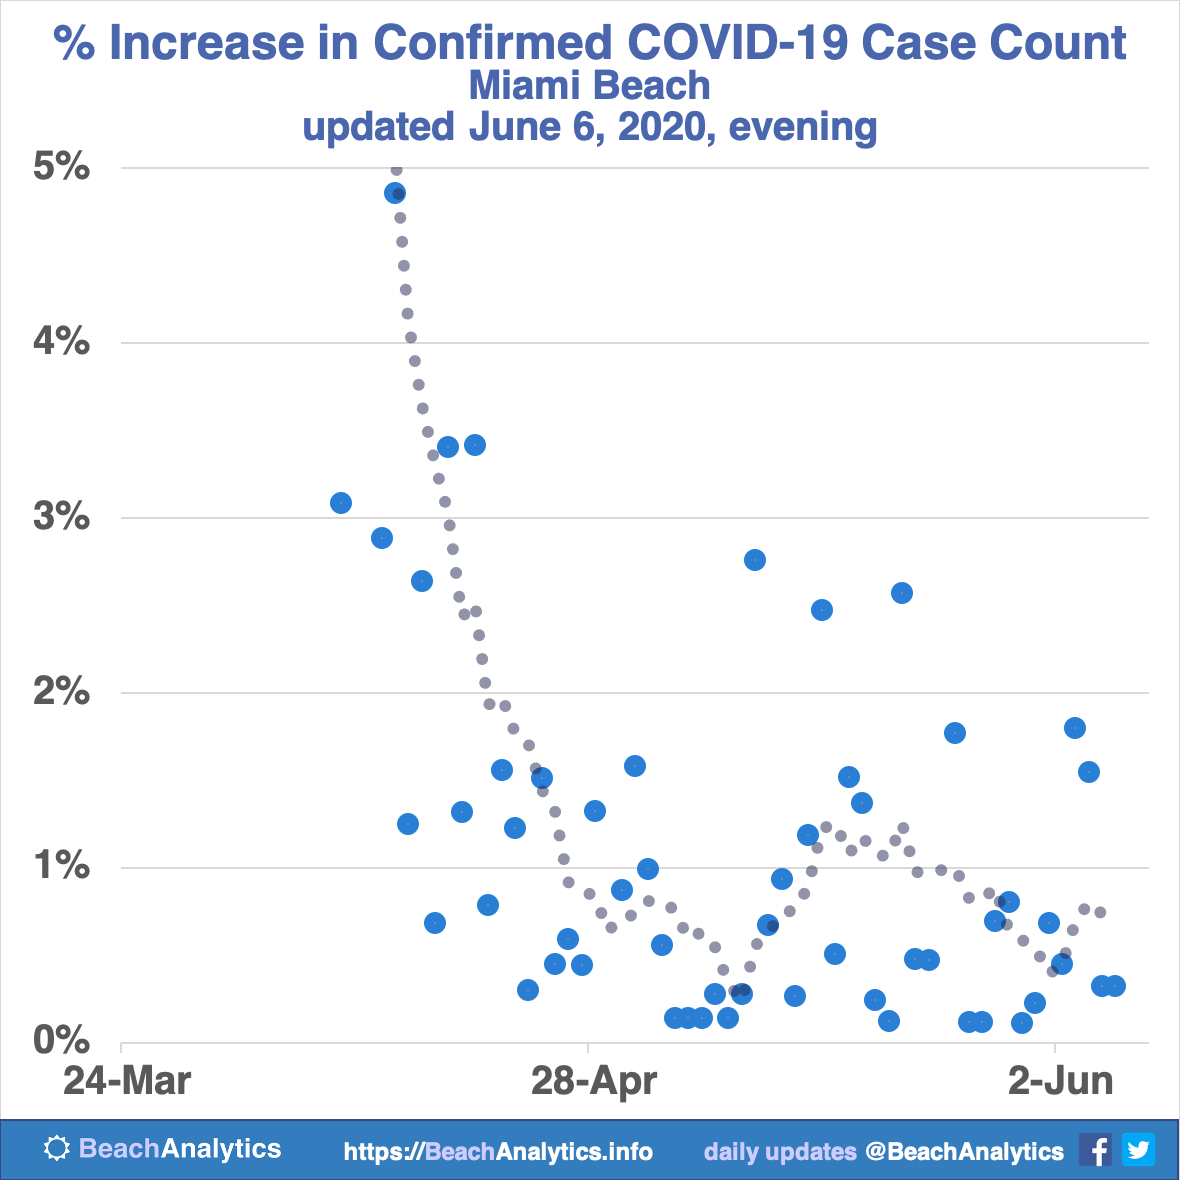
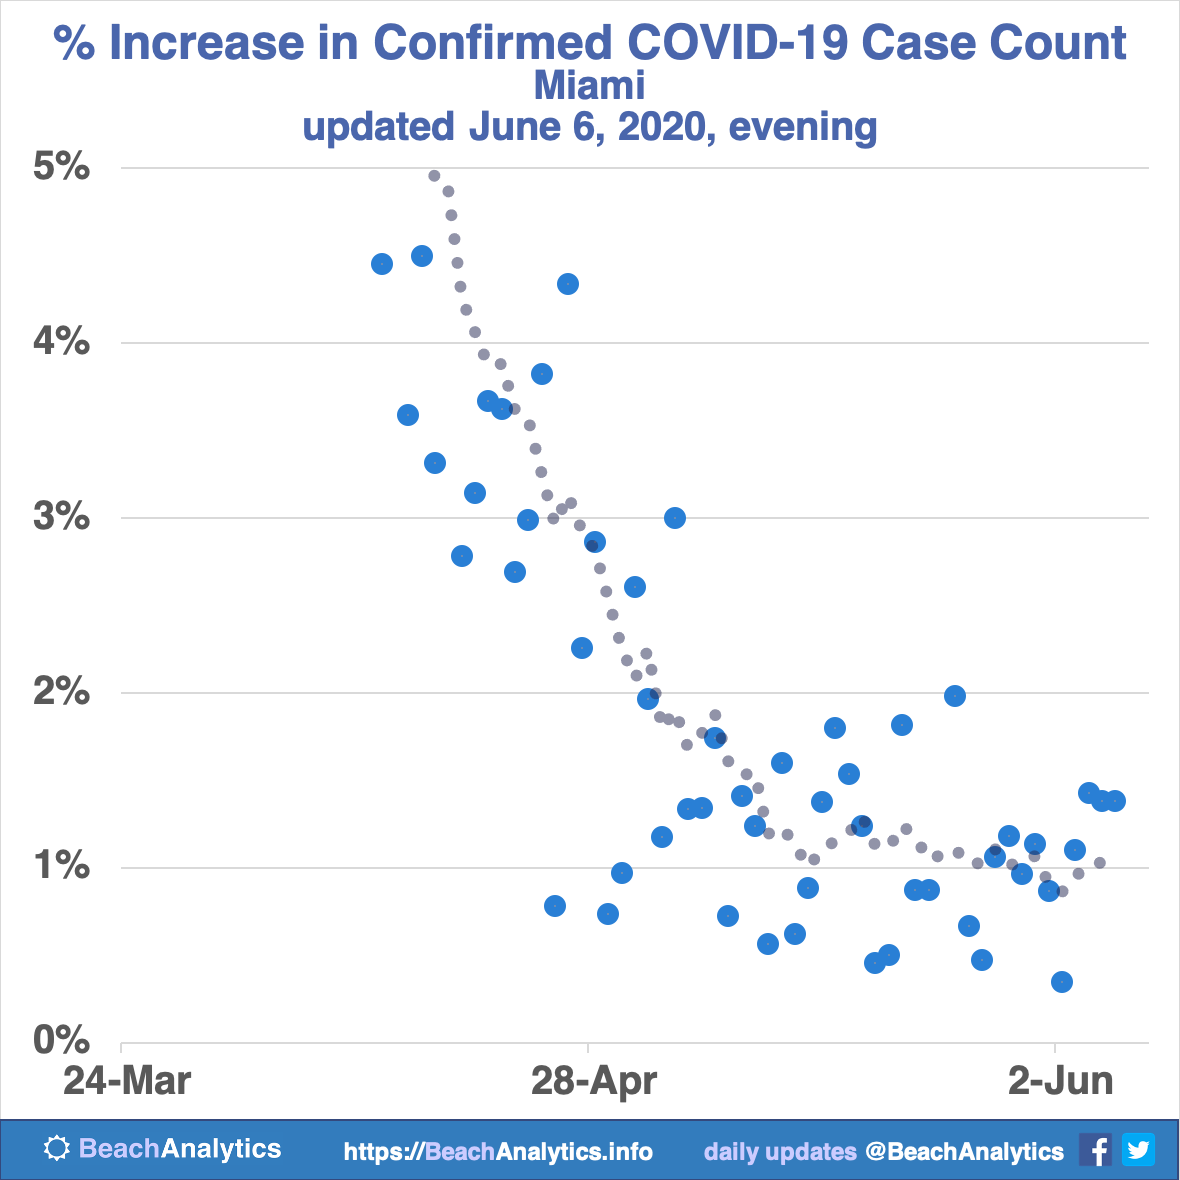
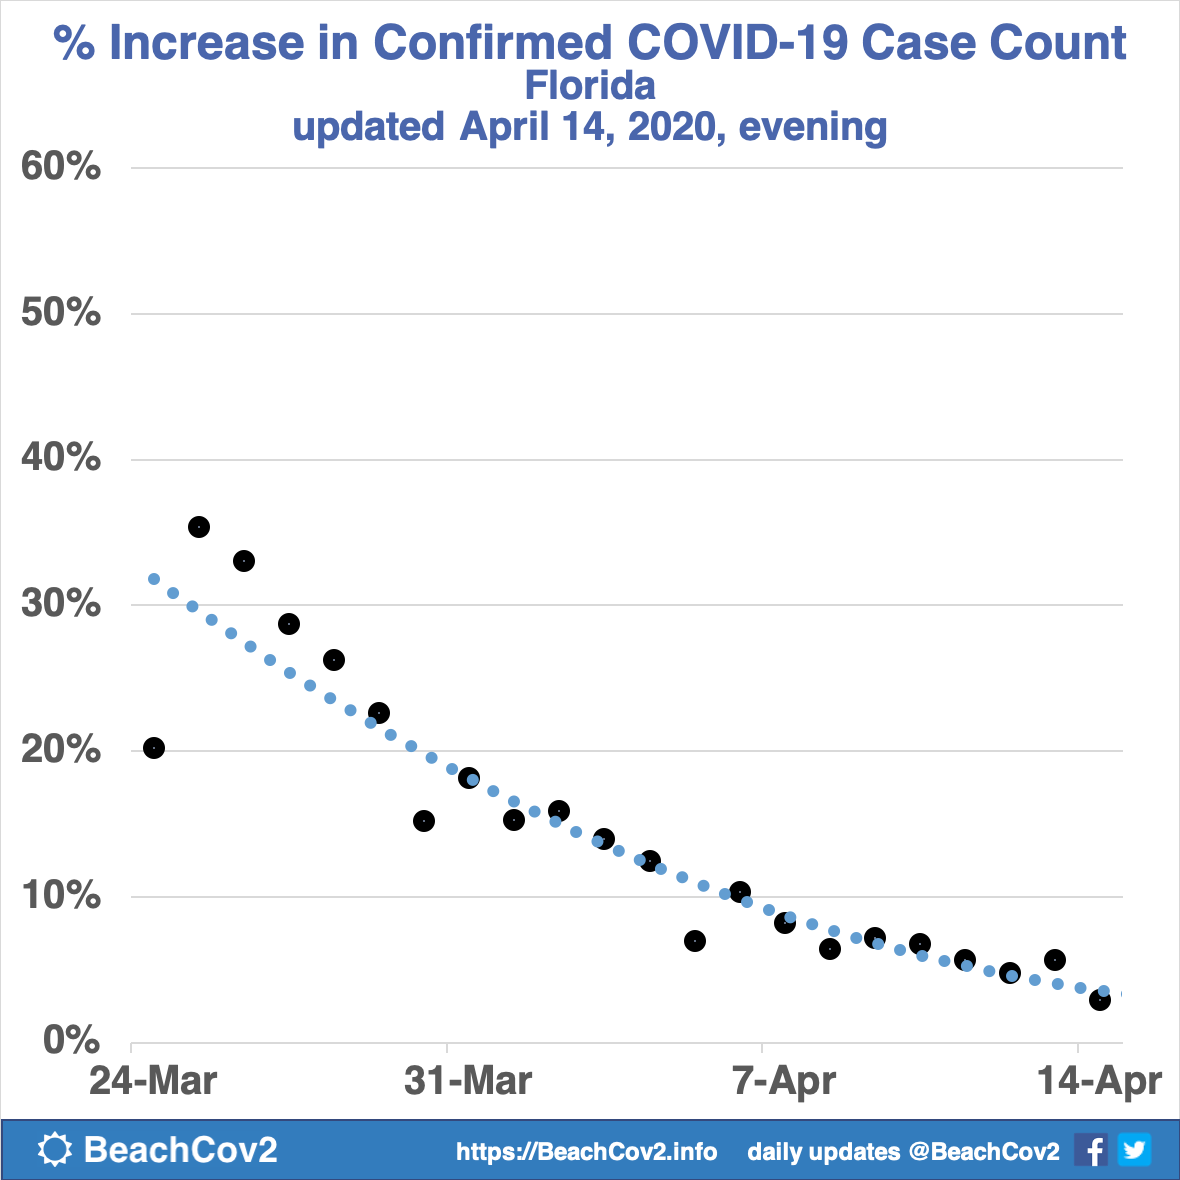
Percent Increase in Confirmed COVID-19 Cases
This chart shows the daily increase in the confirmed COVID-19 cases for each day as a percentage.
Please see the Percent Increase in Number of Confirmed COVID-19 Cases analysis product section for more information and archives of older versions.
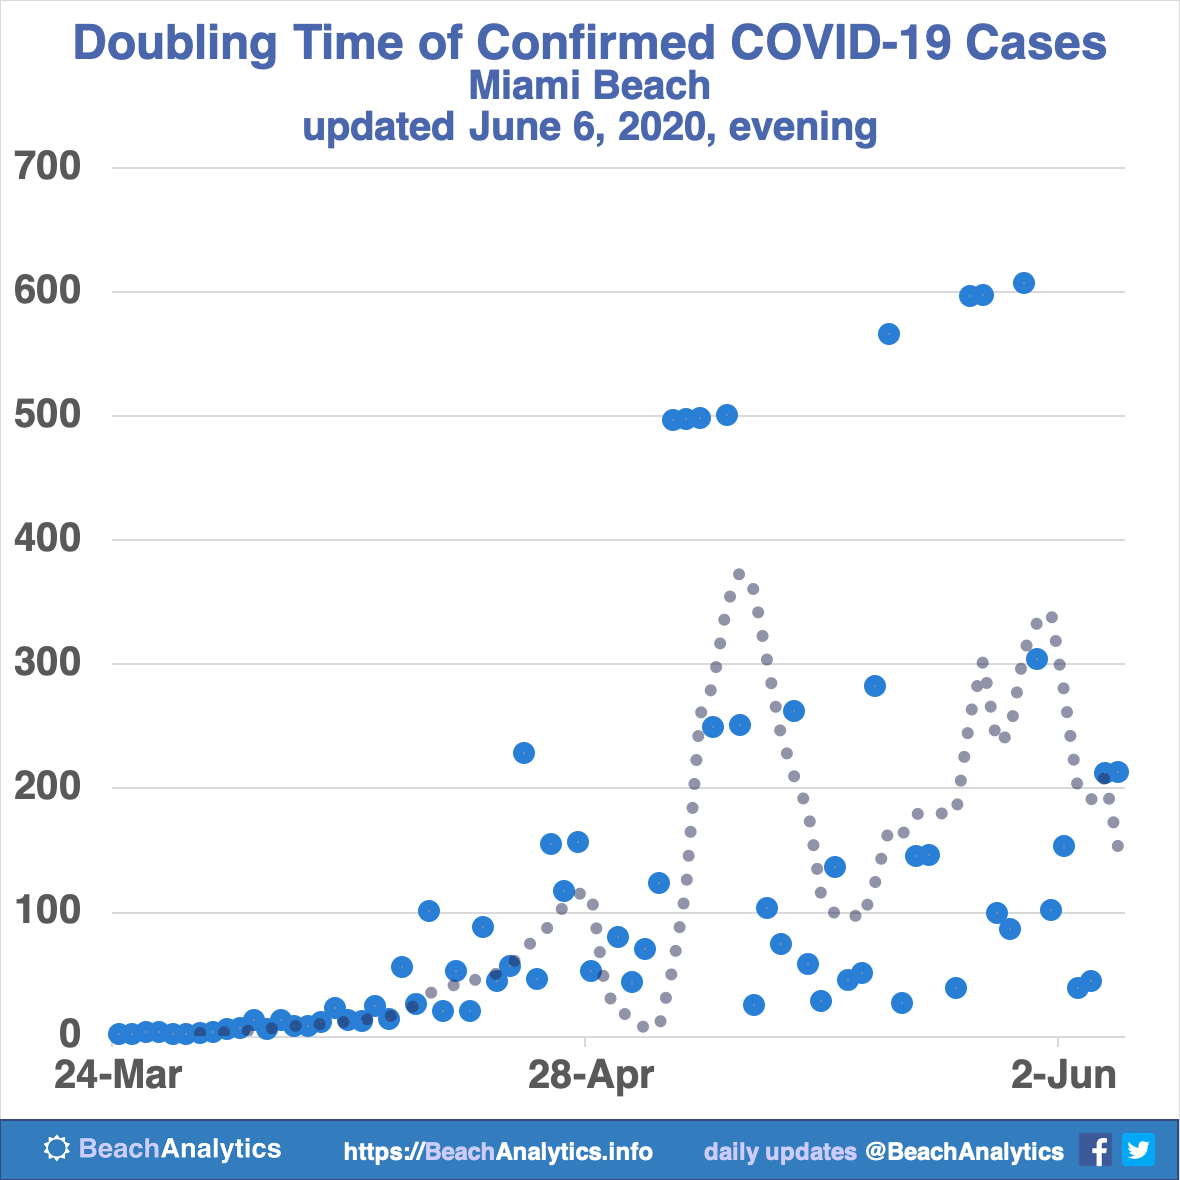
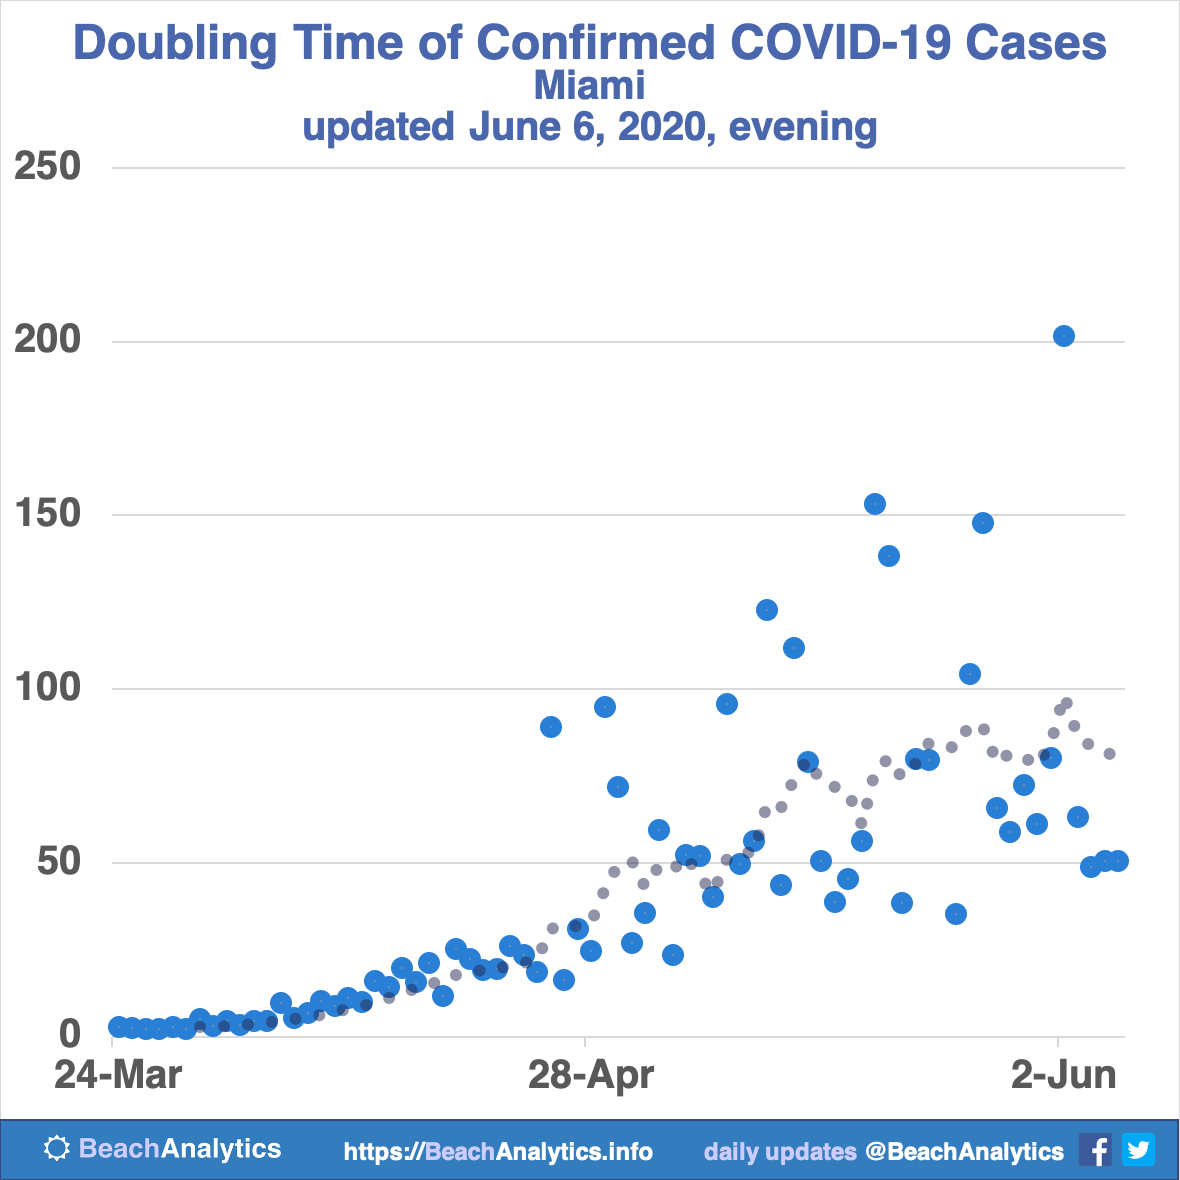
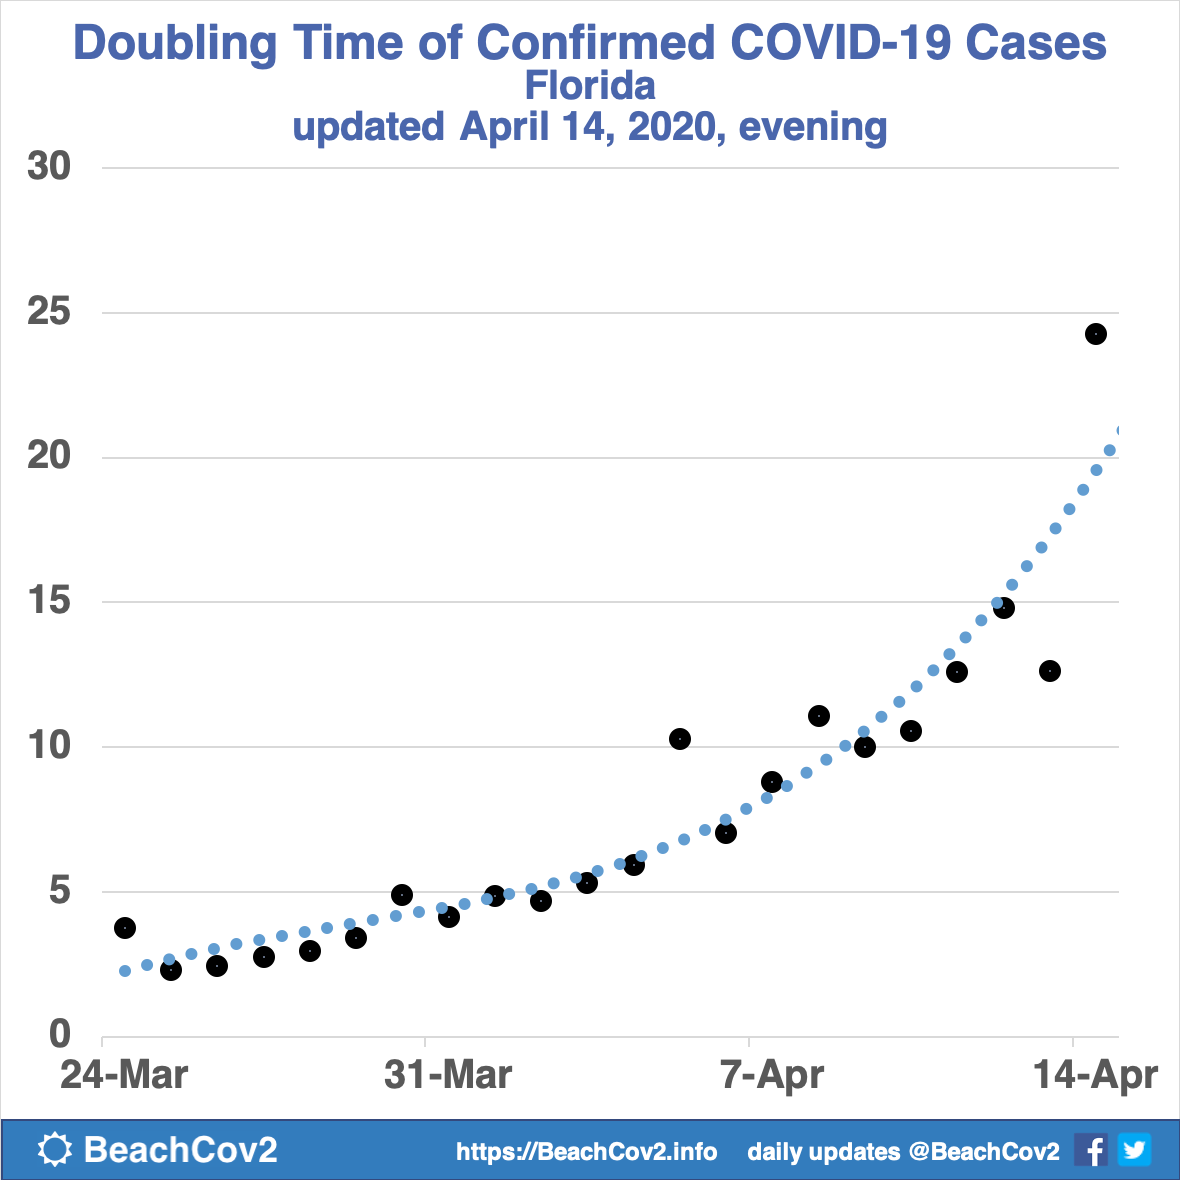
Doubling Time in Confirmed COVID-19 Cases
This chart shows the number of days that it would take for the number of confirmed COVID-19 cases to double, at the current rate each day.
Please see the Doubling Time in Number of Confirmed COVID-19 Cases analysis product section for more information and archives of older versions.
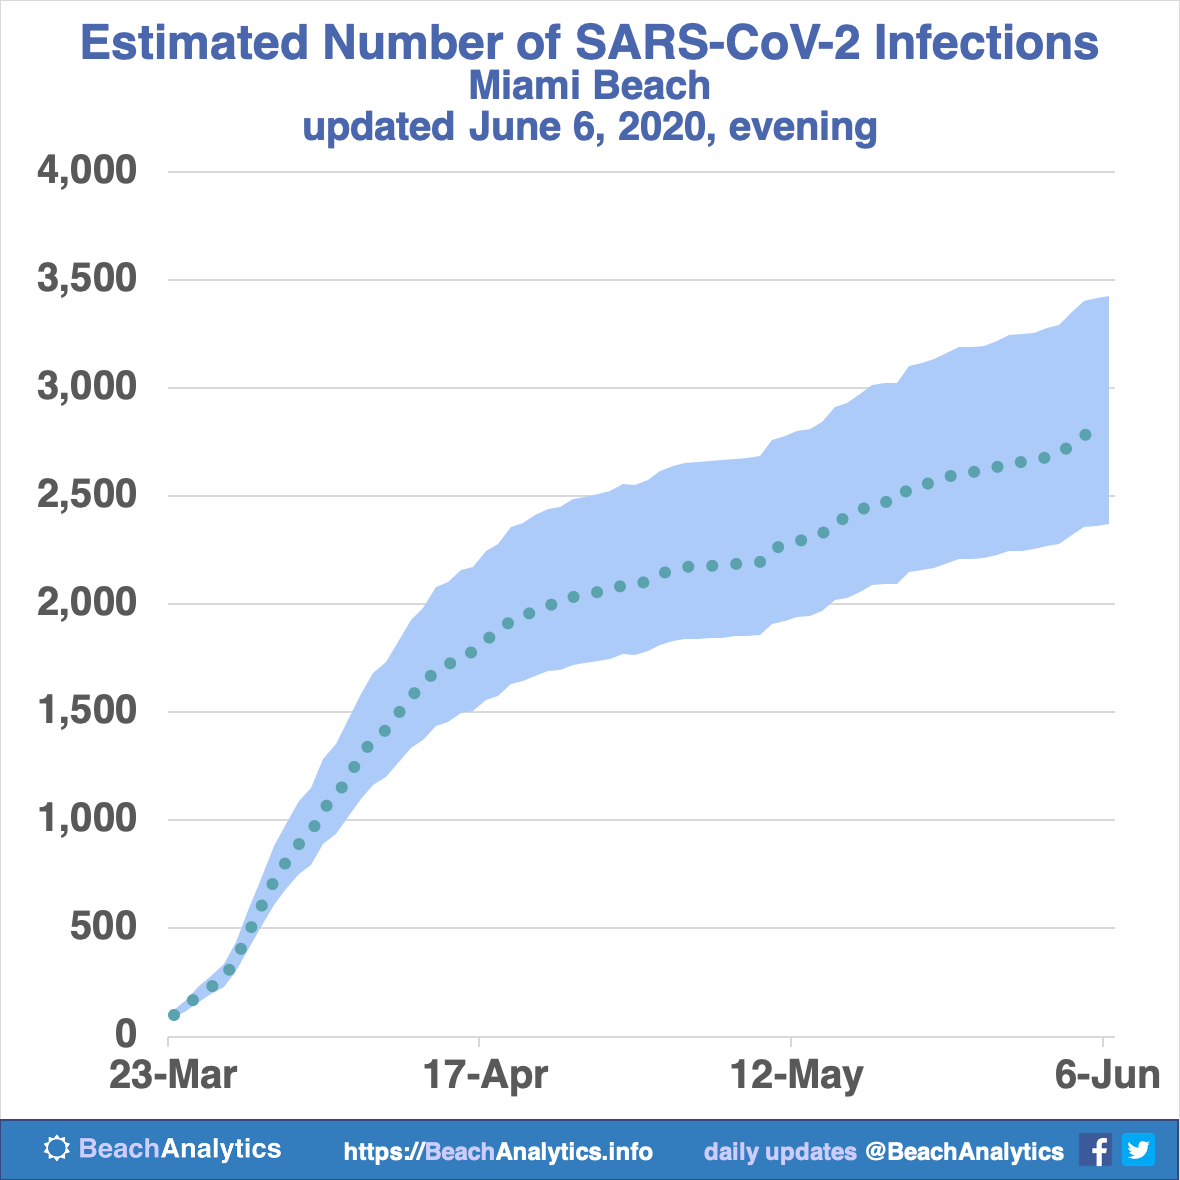
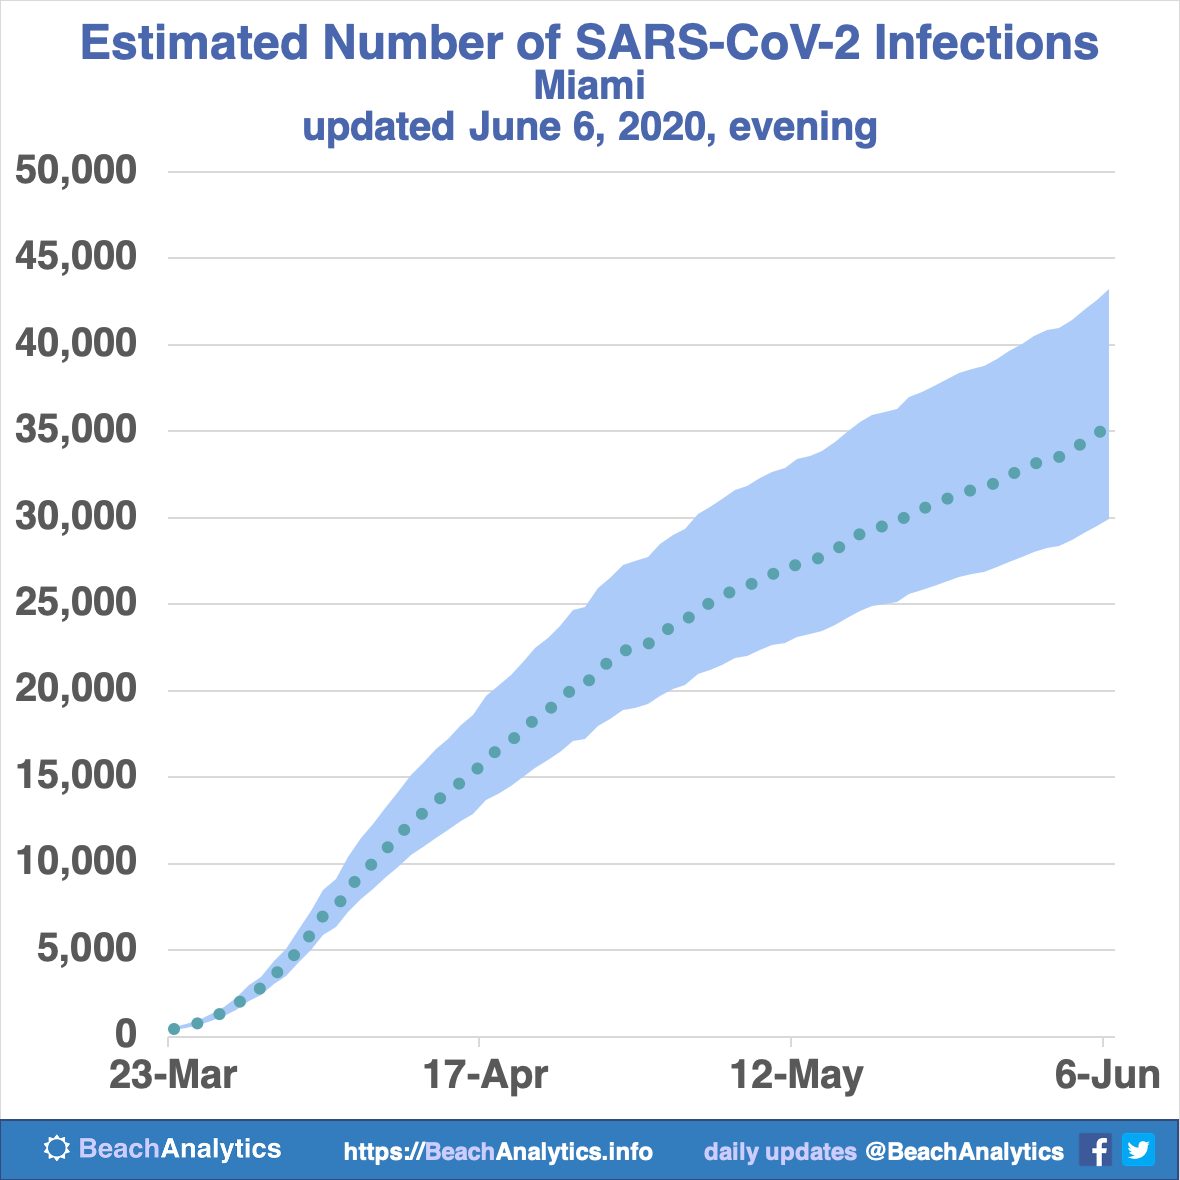
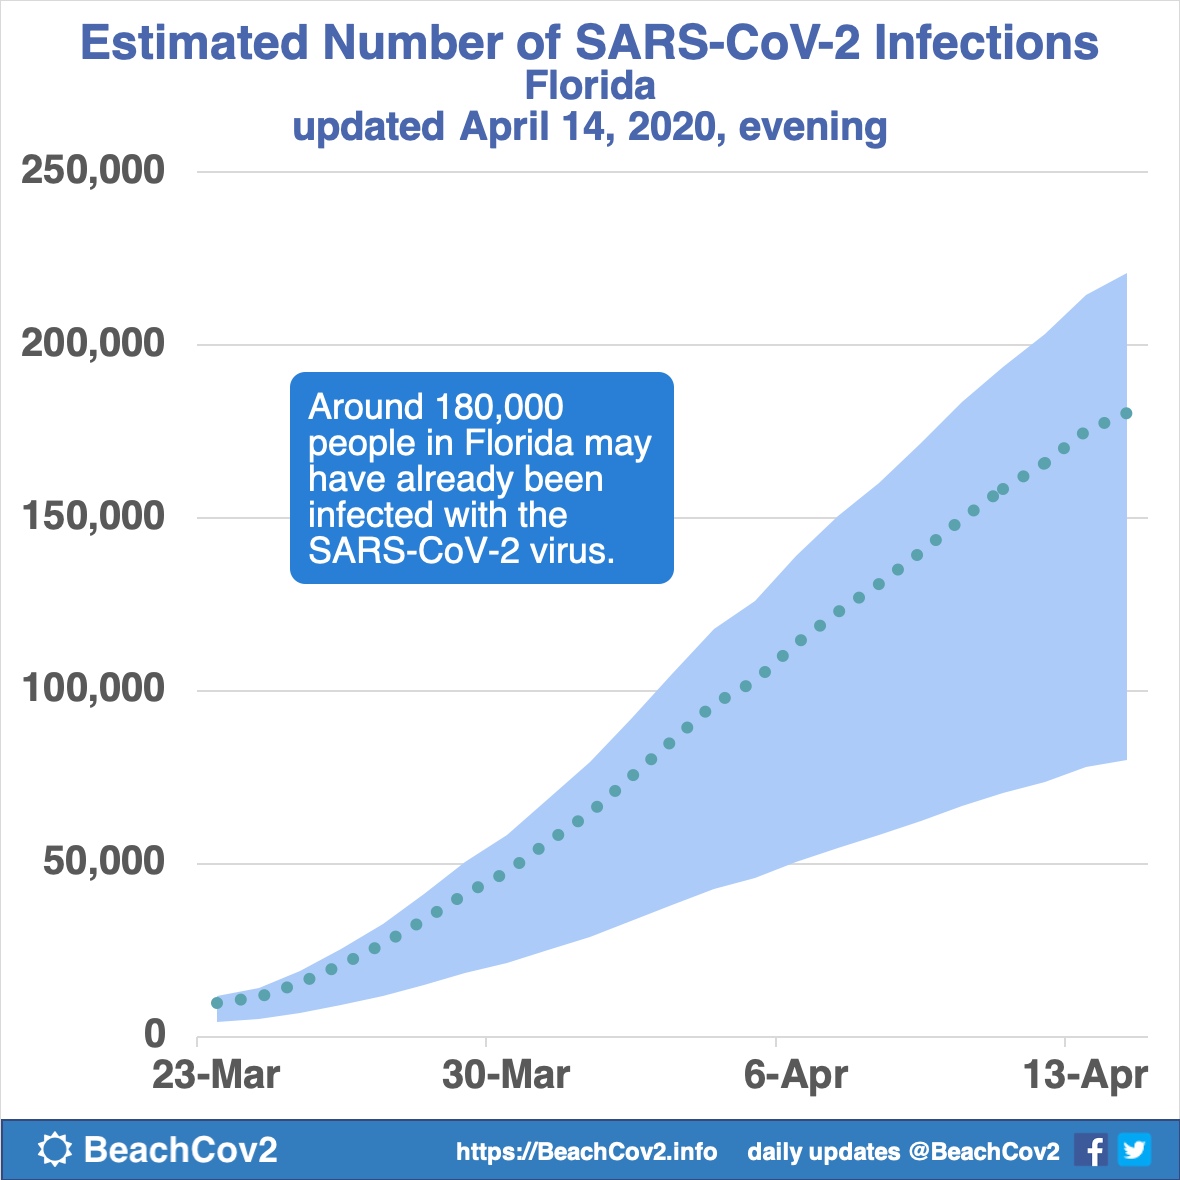
Estimated Number of SARS-CoV-2 Infections
This chart shows a range of estimates for the number of SARS-CoV-2 infections, based on the number of confirmed COVID-19 cases. The range shown in the chart is from a study estimating the number of infections relative to the number of reported cases from the Centre for Mathematical Modelling of Infectious Diseases at the London School of Hygiene & Tropical Medicine. The estimated ranges for various countries are updated periodically, and I'm using the estimated range for the United States. I update my charts whenever the estimated range is updated.
Please see the Estimated Number of SARS-CoV-2 Infections analysis product section for more information and archives of older versions.
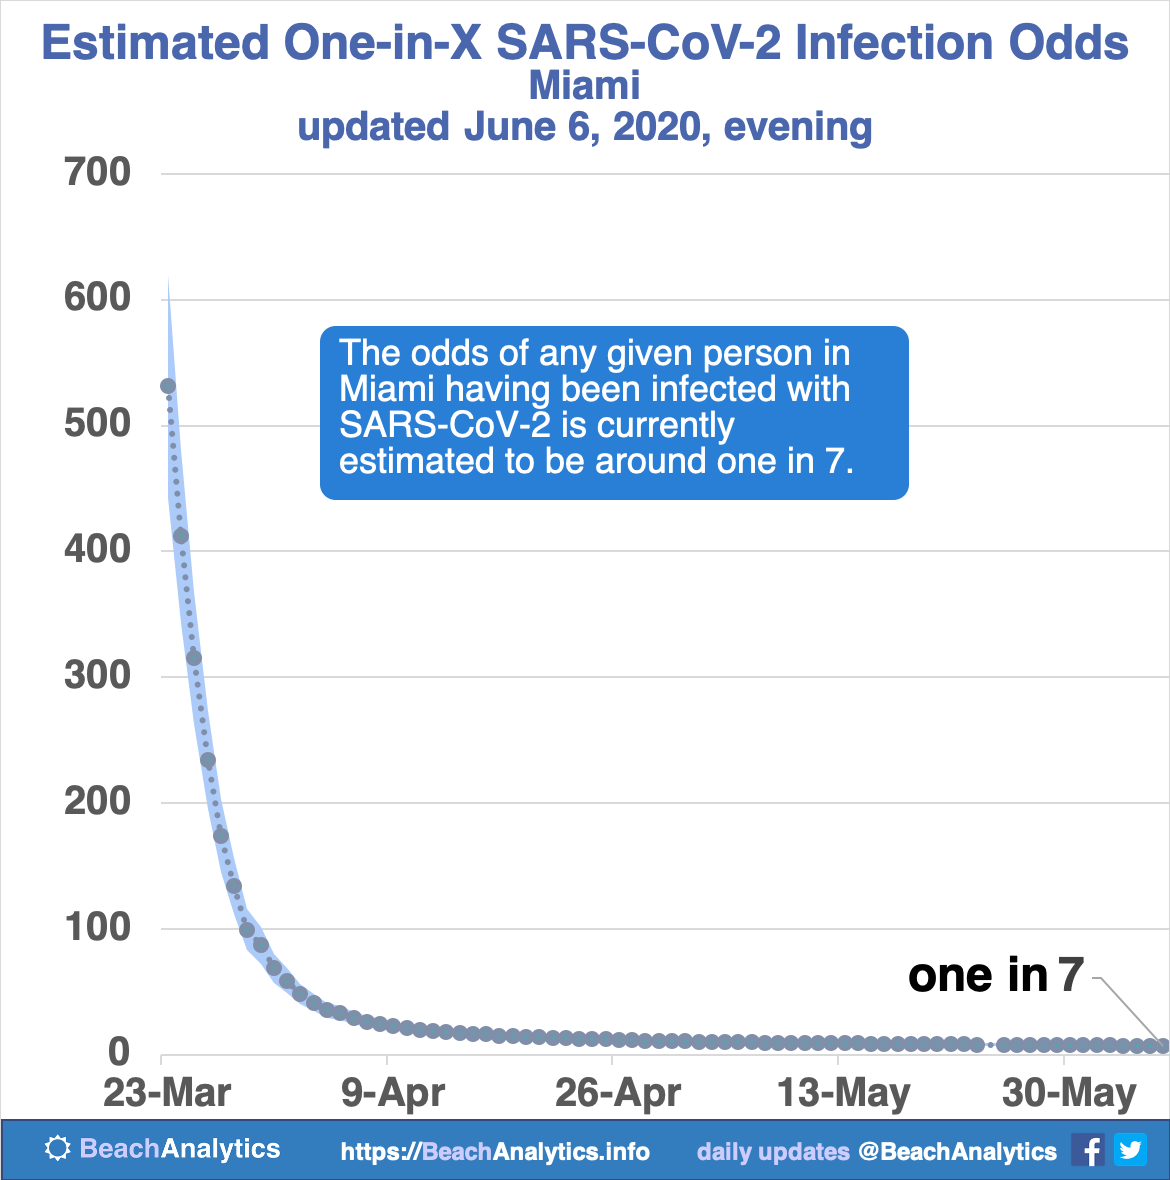
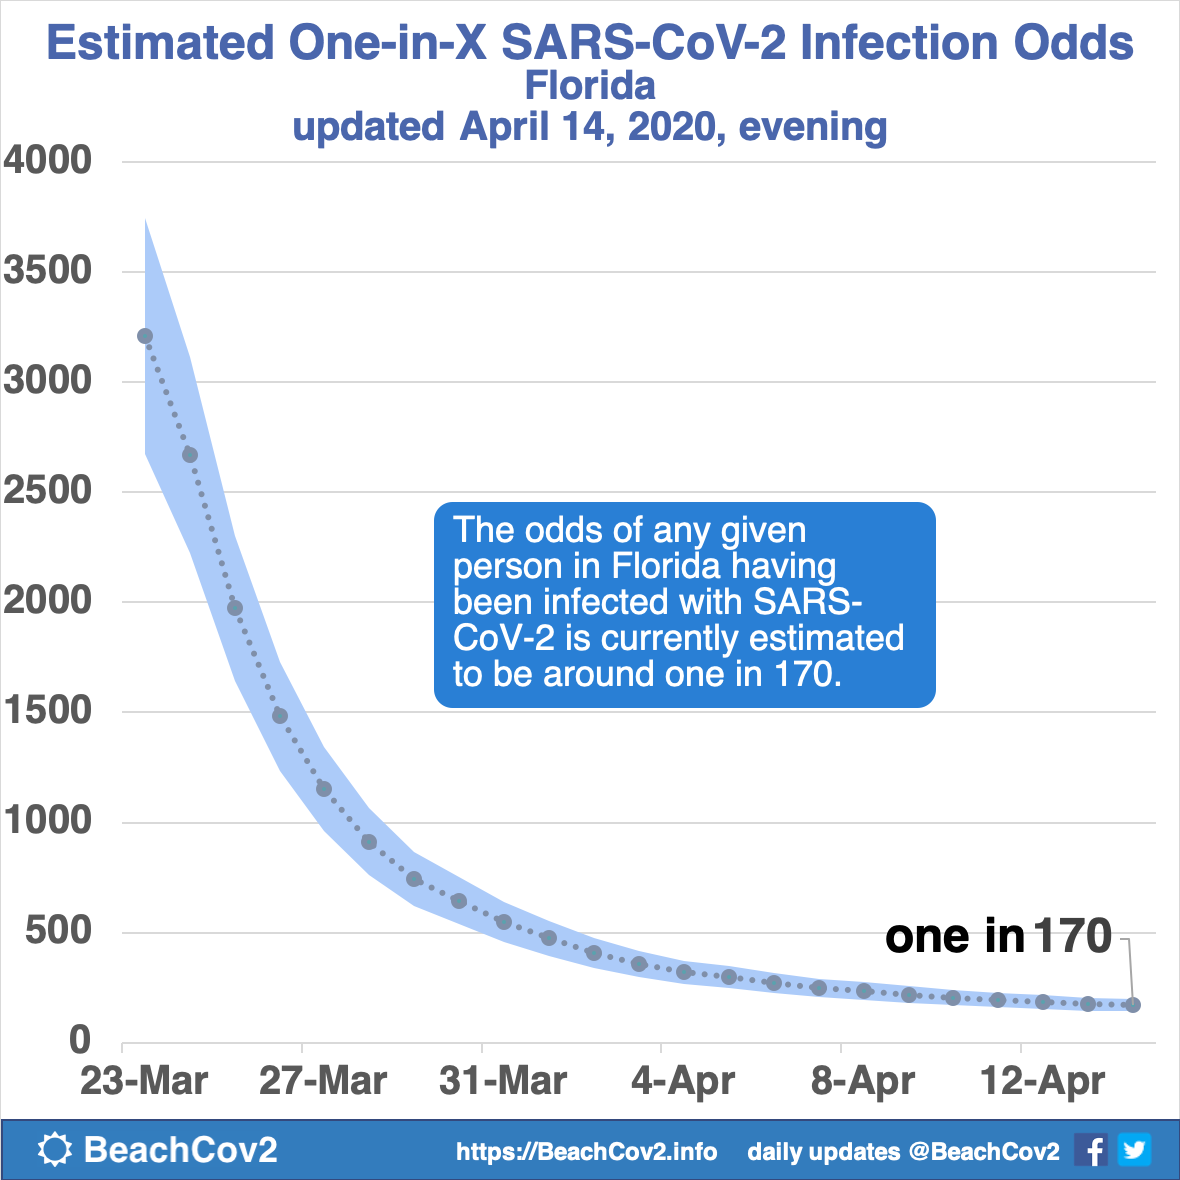
Estimated One-In-X SARS-CoV2 Infection Odds
What are the odds of any given person having been infected?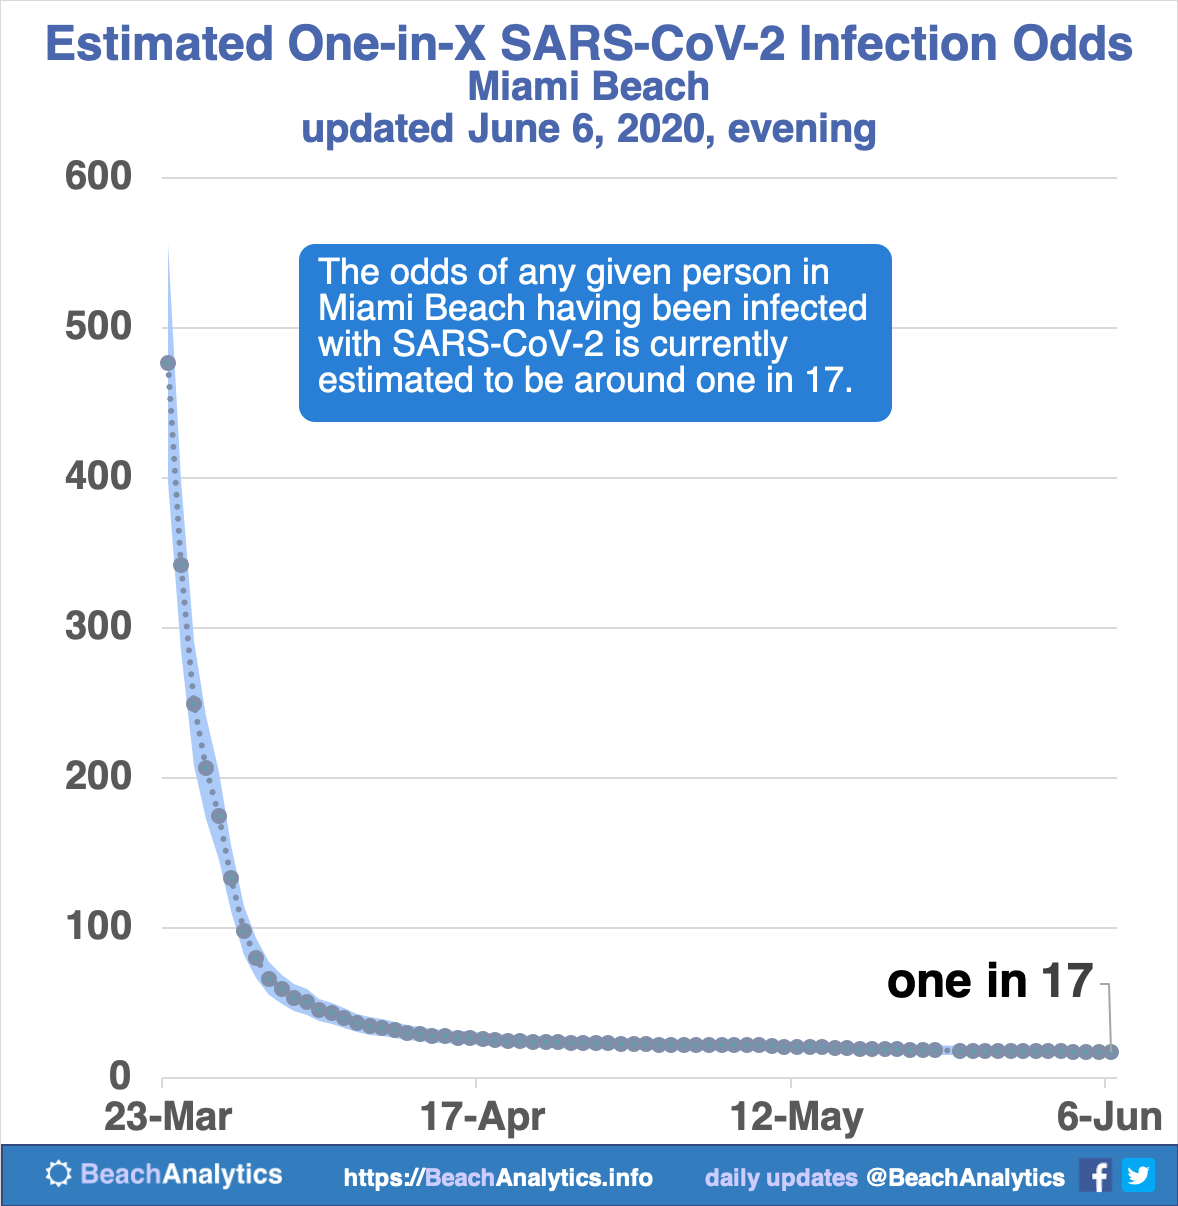
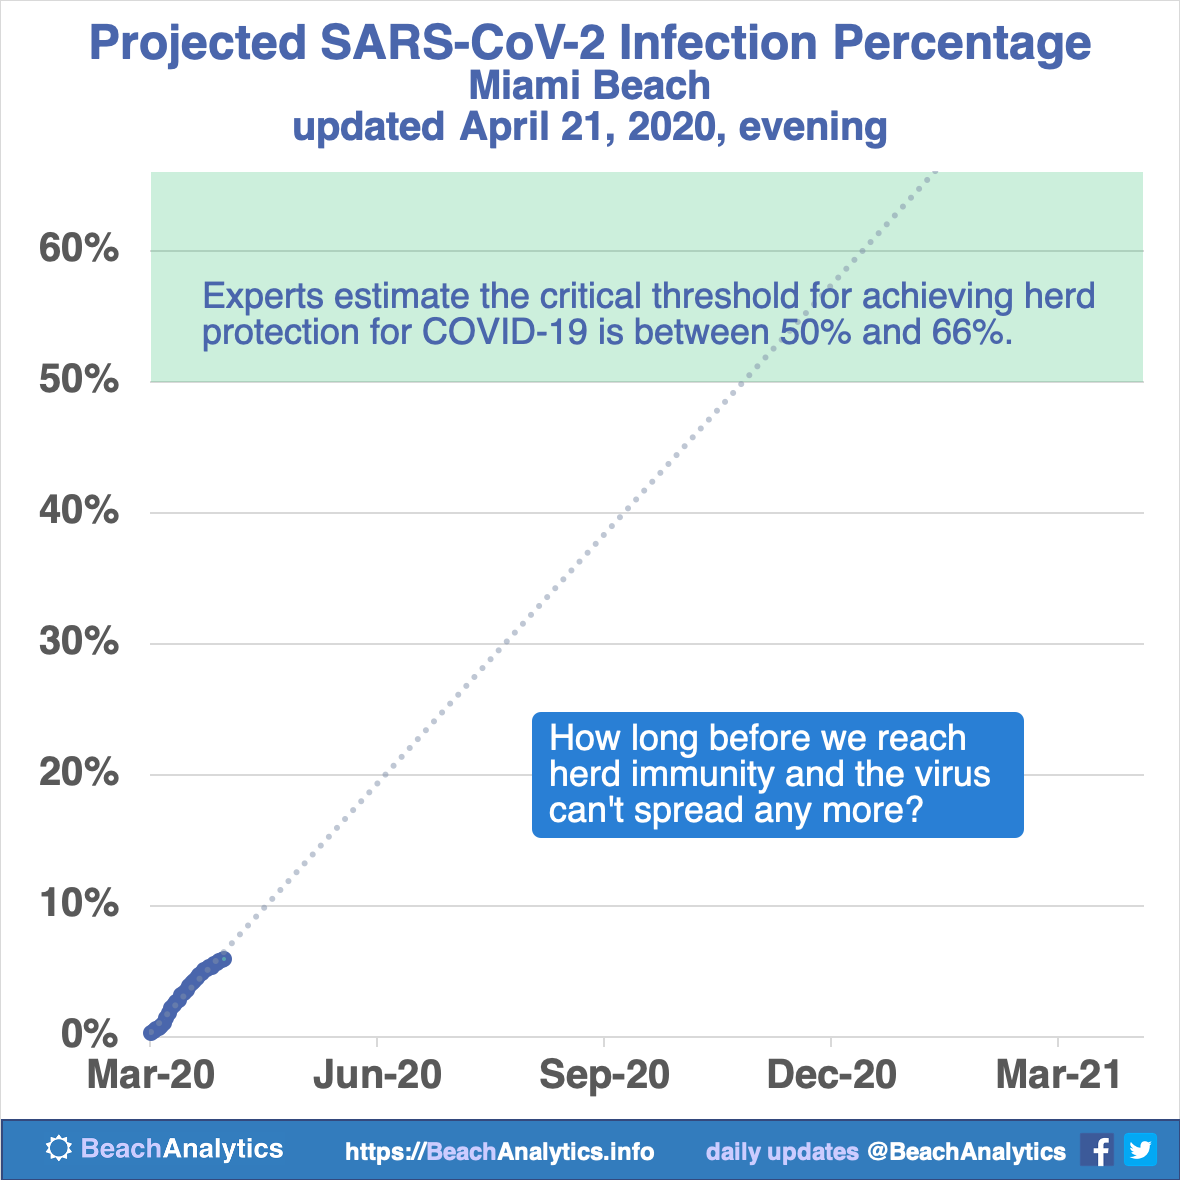
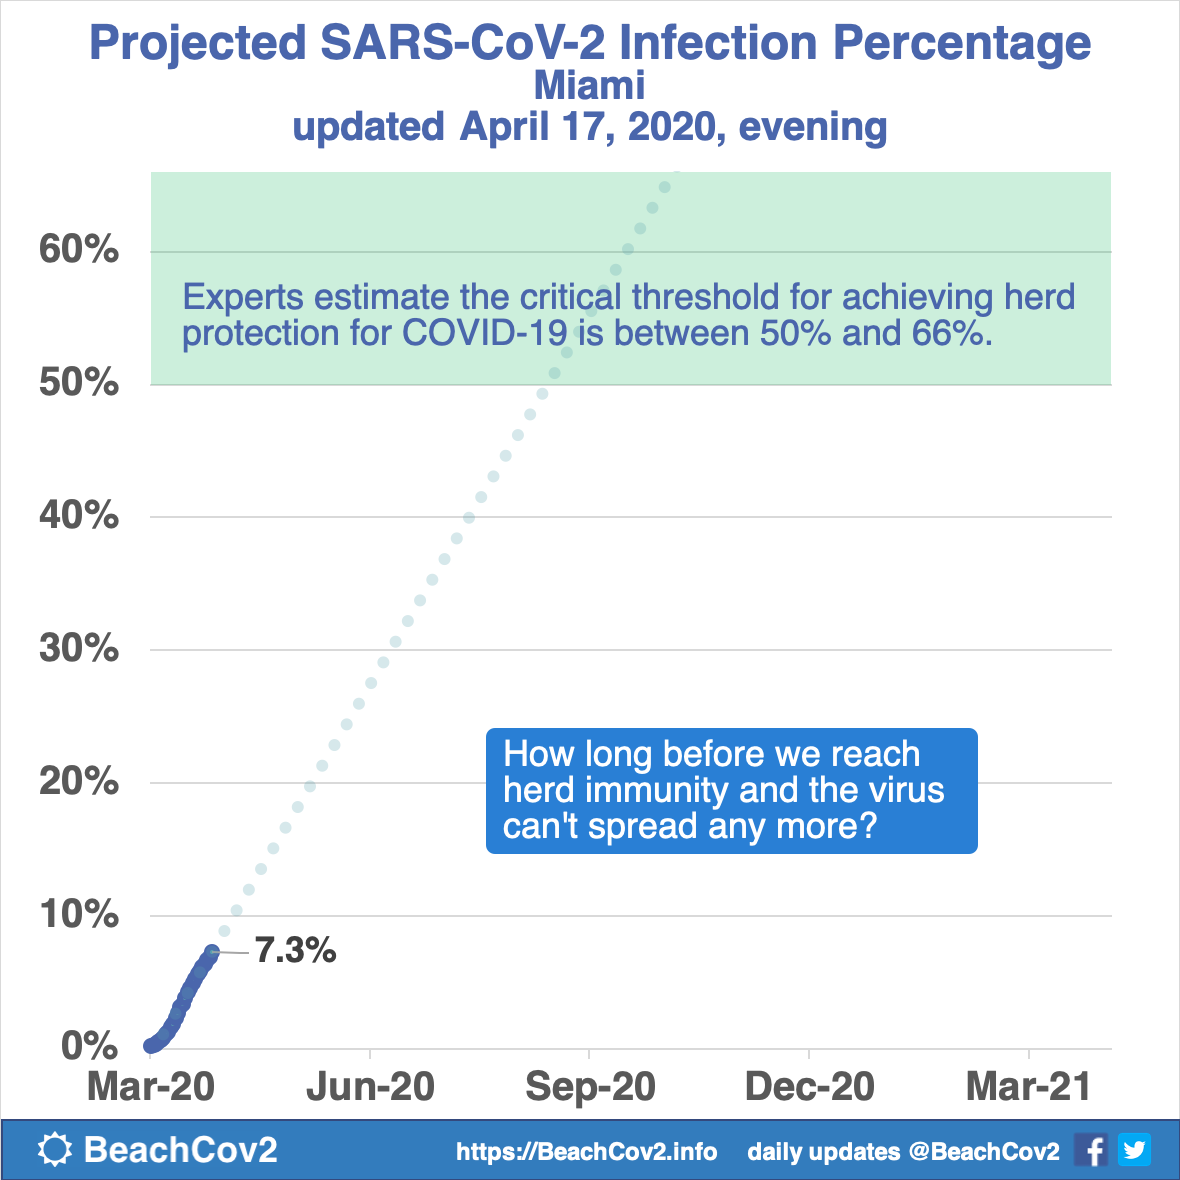
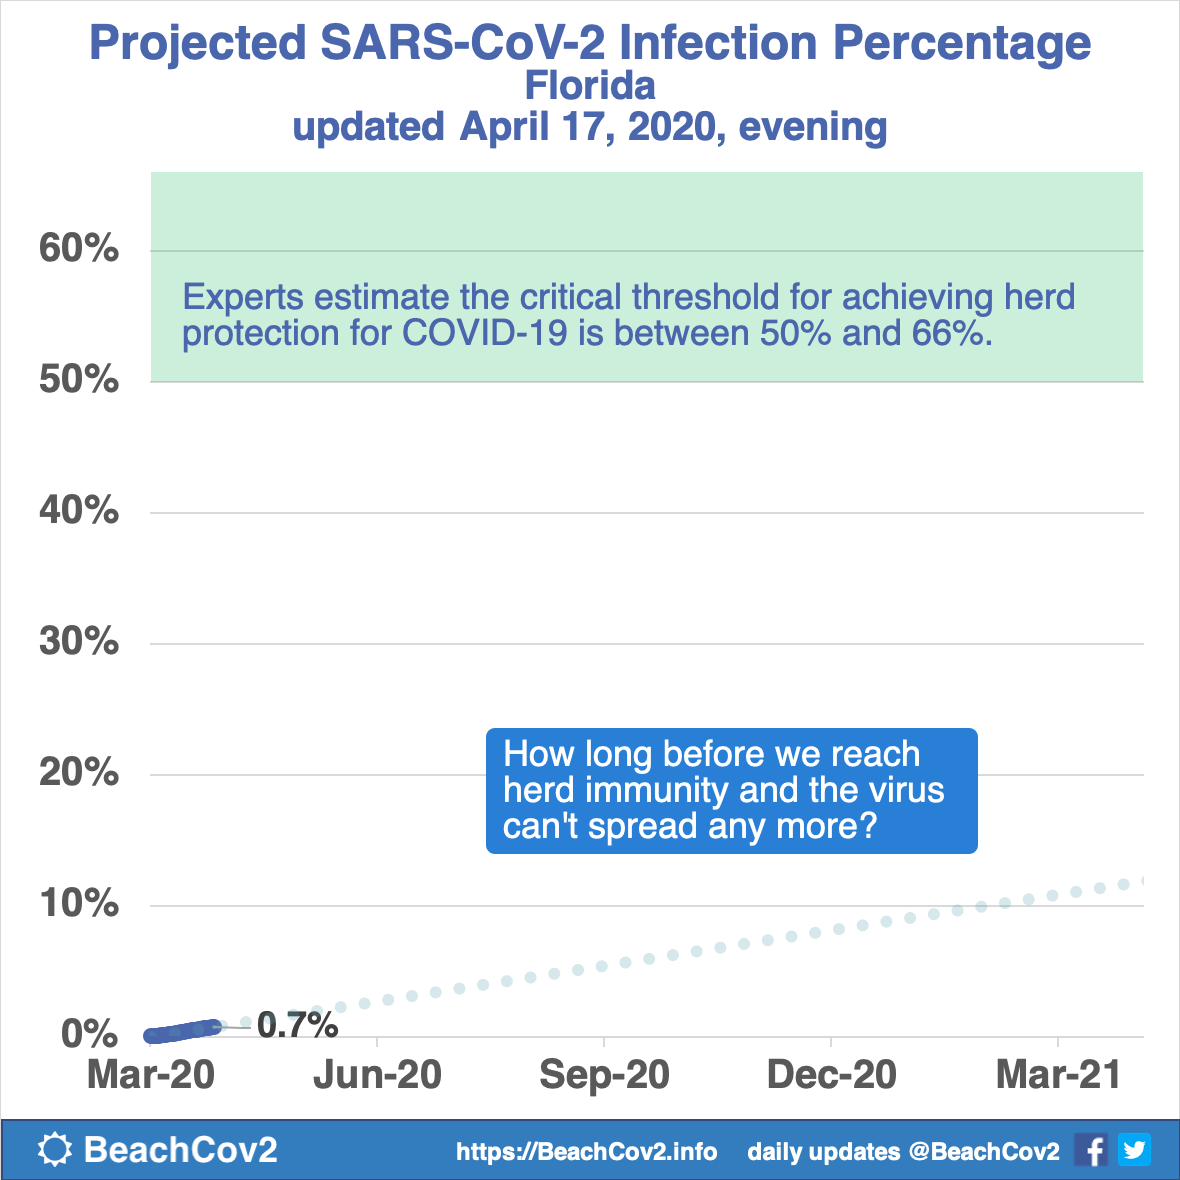
SARS-CoV-2 Infection Percentage Projection
Experts estimate the critical threshold for achieving herd protection for COVID-19 is between 50% and 66%. How long will it take to get there?
This chart uses the same technique as Estimated Number of SARS-CoV-2 Infections to estimate the percentage of the population in the area that has been infected with SARS-CoV-2, based on the number of confirmed COVID-19 cases.
Please see the Current SARS-CoV-2 Infection Percentage Projection Charts analysis product section for more information and archives of older versions.