            Apr 13, 2020
            updated Monday May 11, 2020
Dashboard product documentation
I’ve been posting more slowly in the last couple of days because I’ve been working on a web site for hosting explanations and citations, for showing the current versions of charts, and for chart archives.
Now I have the section of the site set up for the COVID-19 Dashboard analysis product. Here’s the latest, with the new site branding.

Tags
Related
People stopped randomly in public for antibody tests showed a surprising infection proportion.
It’s easy to analyze the Florida Division of Emergency Management’s COVID-19 data now that I got it into spreadsheet form.
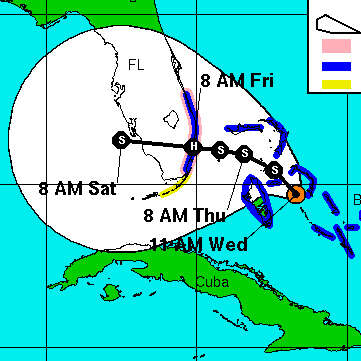
Don’t treat the center line of the IHME forecast charts as a precise prediction, any more than you would assume that a hurricane will follow the center line on the NHC hurricane forecast cone images. The forecast is a wide range, not a specific number.


