            May 21, 2020
            updated Tuesday May 26, 2020

South Florida may see a new outbreak soon
Epidemiologists widely agree that reducing social distancing while we still have active community transmission will lead to an increase in cases, and possibly an uncontrollable outbreak.
We already know that cellphone data shows that South Florida has not been engaging in social distancing as well as we were during the start of the first wave of our coronavirus epidemic.[1,2,3] But what does that mean for us?
Data analysis shows a clear pattern: States that have successfully limited the spread have practiced social distancing more aggressively, and even more so when their death rate started to rise.[4] But there aren’t a lot of epidemiologists tailoring advice to South Florida.
What do the forecast models say?
Most of the computer models can't tell us much about what might happen in South Florida, specifically. Their designers didn’t build them for that.
Many of the models can’t help us to forecast our future in South Florida because they have a coarse granularity, only issuing projections at the state level. Our situation in South Florida is very different from a lot of the rest of the state of Florida, and we need forecasts that can see the difference between a dense, urban area like Miami or Miami Beach, versus rural communities like Dixie County or Highlands County. Researchers have found that the risk of infection and death is different in crowded areas like South Florida, versus rural areas. Large, densely-populated areas like New York and Chicago had nearly twice the rate of transmission in the first two weeks of their outbreaks than less densely-populated areas like Birmingham, Alabama, or the metro area of Portland, Oregon.[5]
Some models, like the University of Texas and IHME models, do account for changes in social distancing, but they update their assumptions about social distancing levels infrequently, and they assume that levels will remain constant until the next update.[4],[6] Researchers at the University of Texas provide this caveat[4] for their forecasts:
Our model explicitly assumes that social distancing behavior remains at the levels we've observed over the last seven days of data. If that doesn't happen, you can throw our model's projections out the window beyond about ten days in the future.
Researchers behind most of the models only designed their forecasts to project one wave of our epidemic. They generally assume that social distancing will remain constant, or they only update their estimates of social distancing levels periodically. Accuracy analysis seems to show that these models can be effective at forecasting a single peak in the death rate that has been mitigated by social distancing. But they can’t account for multiple peaks in the death rate caused by separate waves of COVID-19 transmission.
Forecasting COVID-19 in South Florida
Experts in public health at PolicyLab at the Children’s Hospital of Philadelphia Research Institute have provided a different kind of model. Theirs is the only publicly-available model that projects the risk of a new outbreak in small geographic areas through the summer as we begin to reopen now, while accounting for other changing factors such as weather.[7,8,9]
As our leaders plan for when and how to reopen communities, understanding the highly contagious nature of this virus and the factors that impact its spread must inform those decisions. Complementary to other national models, our data differ in that they illustrate the situation in our own backyards. With our model, we hope to help city leaders and public health officials build more targeted strategies for reopening communities that consider not only the strain on our health care systems, but also how to deploy other strategies such as masking and workplace safety regulations to maintain some distancing as people leave the confines of their homes.
PolicyLab researchers found that warming spring temperatures are helping to reduce the spread of SARS-CoV-2 infections in some areas, but that effect is dwarfed by the impact of population density.
The PolicyLab model, known as COVID-Lab: Mapping COVID-19 in Your Community looks at how population factors like age, insurance status, and smoking prevalence have affected the number and spread of coronavirus cases across a county. Their model also looks at city characteristics like density. It uses the same cellphone mobility data from Unacast that showed us recently that South Florida has started to give up on social distancing,[10] and it has identified social distancing as the most important factor in reducing transmission.
Measured against a number of local factors, we saw that strict social distancing policies and low population density, and, to a lesser extent, warming weather were all important in slowing the spread of this dangerous virus. We were especially interested to find that rising temperatures may have helped reduce the spread of COVID-19, particularly in our less populous counties, but unfortunately the effect of weather, in the absence of strict social distancing policies, has not been strong enough to prevent resurgent transmission in our most crowded cities and their metropolitan areas.
Projections for Miami-Dade and Broward
Unfortunately, the projections from the PolicyLab model don’t look good for us.
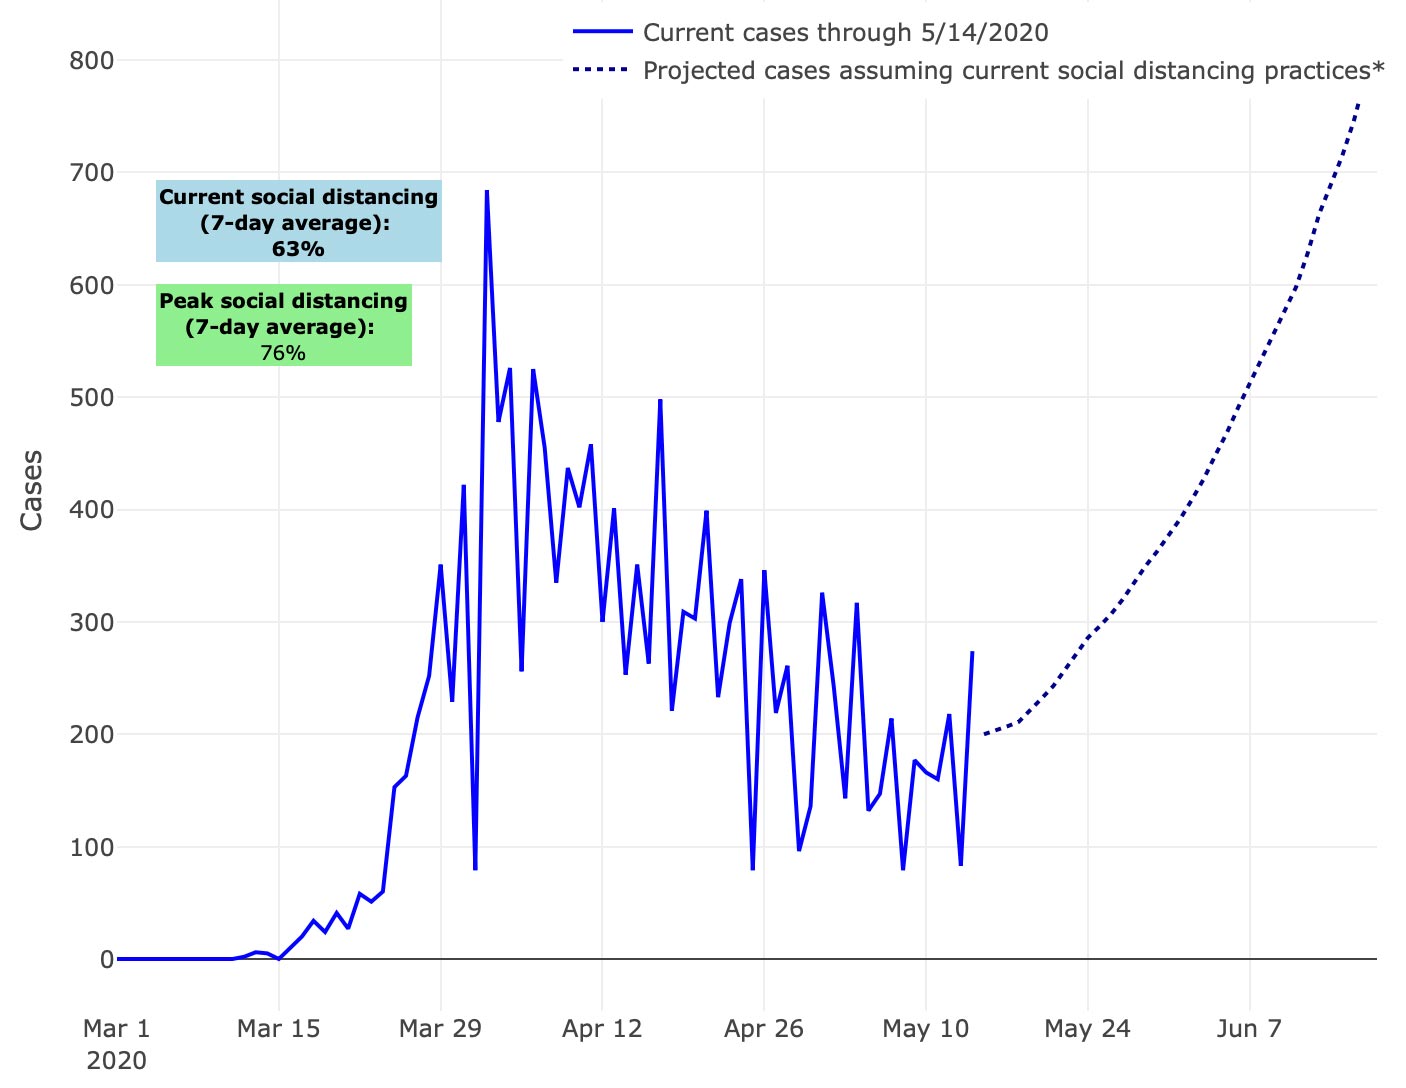
credit: PolicyLab
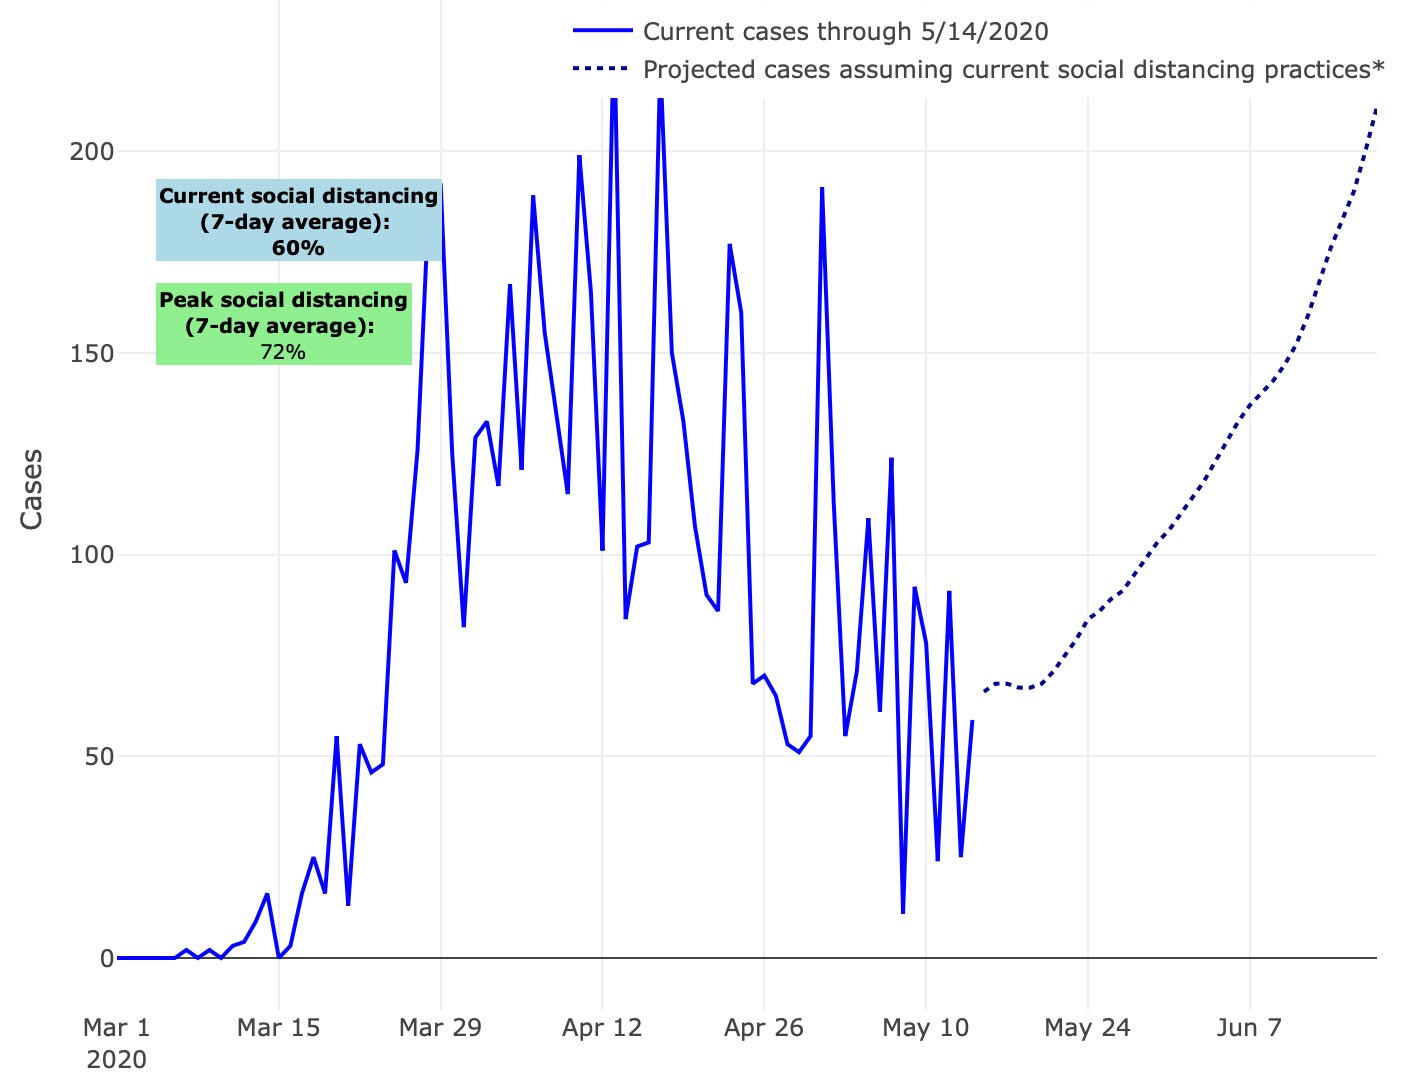
credit: PolicyLab
The model estimates that each person infected with SARS-CoV-2 in Miami-Dade County might already be infecting more than one person, on average. The infection will begin to spread exponentially again if this metric goes above 1.0 for an extended period.
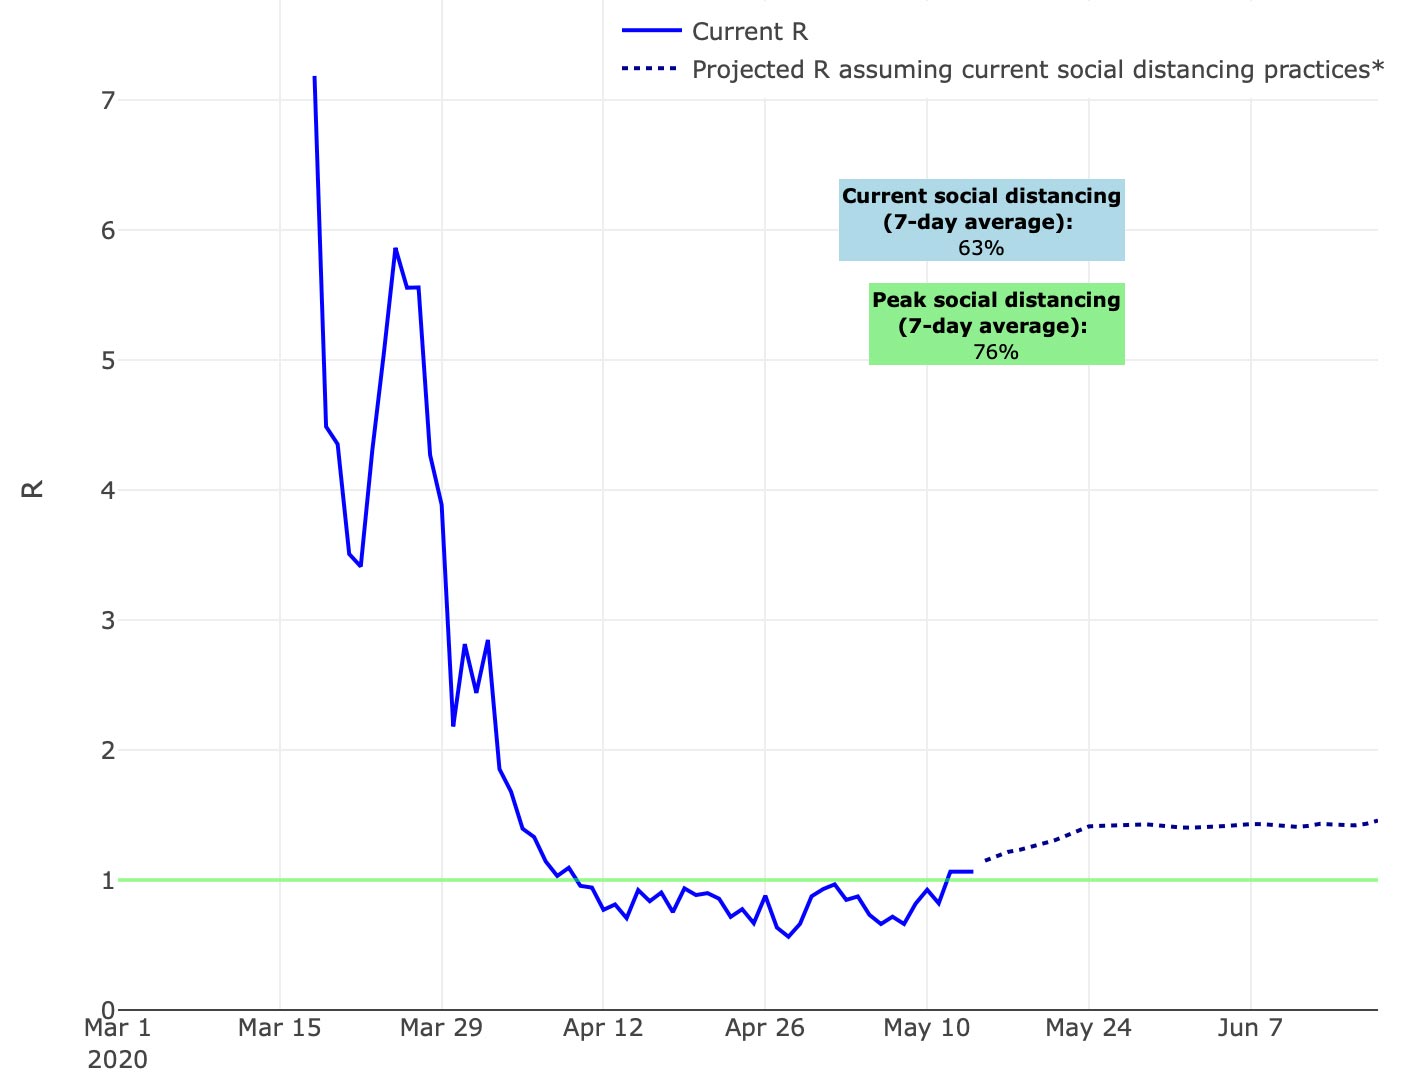
credit: PolicyLab
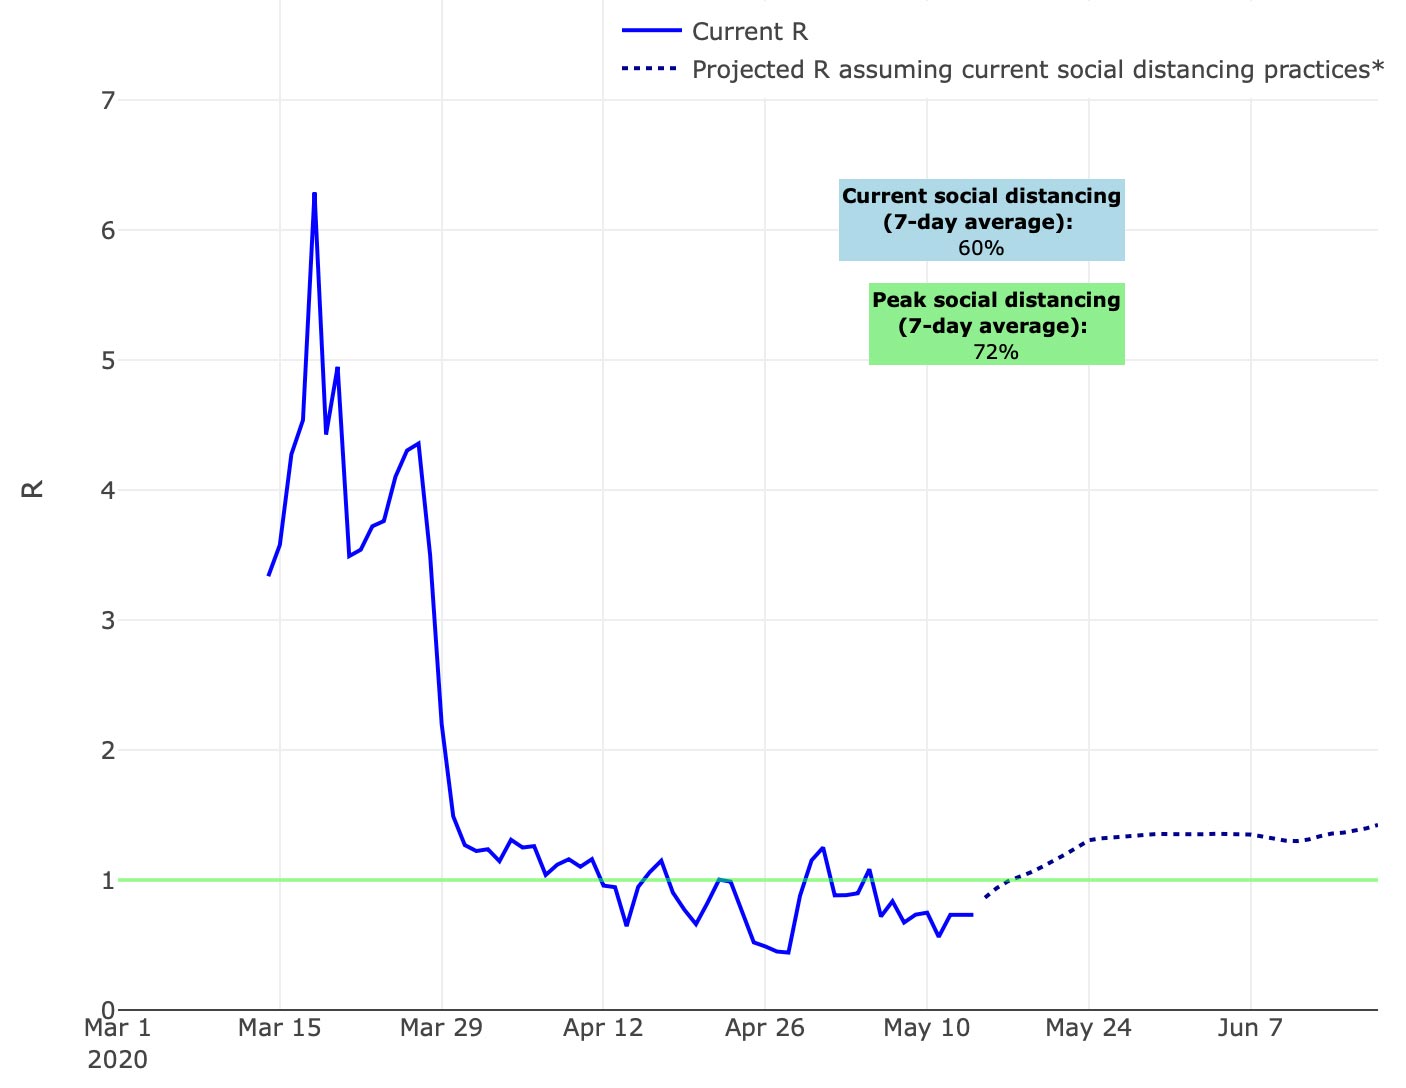
credit: PolicyLab
Another model echoes the same warning for Florida
The Imperial College COVID-19 Response Team is using a similar statistical model that projects the impact of increases in mobility.[11] Their model does not address the potential impact of changes in behavior. Like mask-wearing and attempts at social distancing in public settings like restaurants and beaches. Their model doesn’t reach the county-level granularity that the PolicyLab model does, but it reinforces the PolicyLab suggestion that the outbreak is not under control in Florida. And that changes in mobility could lead to an exponential growth in infections and deaths.
Their model avoids conveying false precision by preventing results as a range of confidence instead of a single center line like the PolicyLab model. They give projections based on three different scenarios:
- Mobility stays constant, which was can clearly see is not the scenario that’s happening.
- Mobility increases by 20%. We know from other data that this has already happened.
- Mobility increasing by 40%.
Their dashboard for Florida for their model output shows a few disturbing charts, including this one for projected deaths:
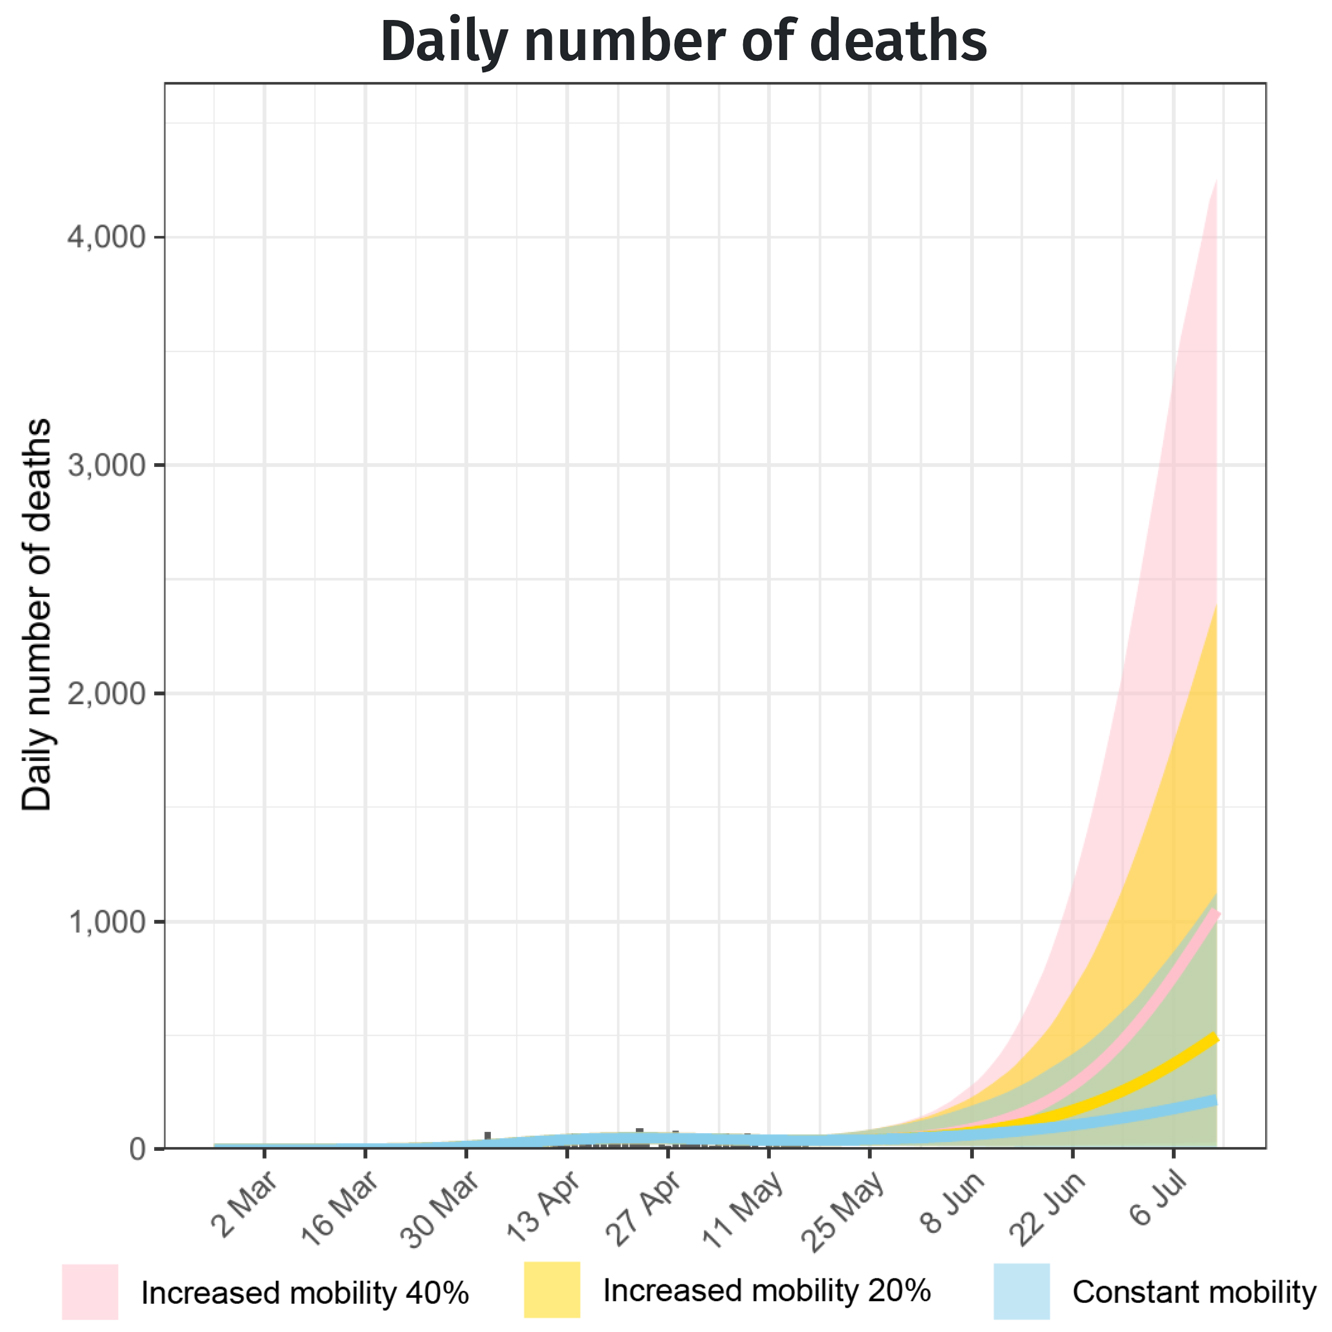
credit: Imperial College COVID-19 Response Team
The Imperial College model also doesn’t account for Memorial Day weekend crowds.
What does this mean for us here?
David Rubin and Paul A. Offit from PolicyLab advise that rural areas that are less densely populated or that are already benefiting from warmer spring temperatures will probably be able to reopen more quickly, as long as the number of cases in their area has sharply reduced.[5]
But they say that large, densely populated cities like Miami need a more cautious plan. For two reasons: More crowded areas increase the risk of spread. And also because we’re learning that crowding itself may also affect the death rate. You could get sicker and have a higher risk of dying if you're exposed to more of the virus because you’re in a densely-populated area. That’s also what seems to have happened during the 1918 Influenza pandemic.[12] One of the first studies of a documented super-spreading event from carnival festivities in Germany also showed that people who were infected in dense crowds ended up sicker than those who were infected in other scenarios.[13]
We found a highly significant increase in both infection rate and number of symptoms when people attended carnival festivities, as compared to people who did not celebrate carnival.
One of the biggest factors in the PolicyLab projections is social distancing, and their model assumes that social distancing levels will remain constant in the future.(missing reference) So, if social distancing levels continue to decrease as South Florida reopens then updates of the model could look even worse for us here.
In South Florida, we should remember as we make decisions about reopening that nation-wide and state-wide trends and forecasts don’t necessarily apply directly to us. Because they include a lot of areas where we know that the rate of the spread and the death rate will probably be significantly lower than we will experience here. The only forecast model currently available that’s aimed at helping us with those decisions for our local community is warning that we may soon see a new outbreak that may be impossible to control.
References
- 2. U.S. Geographic Responses to Shelter in Place Orders. SafeGraph; link (Accessed 2020-05-21 14:20)
- 3. Coronavirus: Changes in US Mobility. Descartes Labs; link (Accessed 2020-05-21 21:30)
- 4. Mortality Modeling FAQ. The University of Texas at Austin COVID-19 Modeling Consortium; link (Accessed 2020-05-21 14:30)
- 5. We Know Crowding Affects the Spread. It May Affect the Death Rate. The New York Times; 27-April-2020 link (Accessed 2020-05-21 15:00)
- 6. Forecasting the impact of the first wave of the COVID-19 pandemic on hospital demand and deaths for the USA and European Economic Area countries. IHME COVID-19 health service utilization forecasting team; 21-April-2020 link (Accessed 2020-04-27 16:00)
- 7. New Model Shows Competing Influences of Social Distancing, Population Density & Temperature on Local COVID-19 Transmission. PolicyLab at the Children’s Hospital of Philadelphia Research Institute; 22-April-2020 link (Accessed 2020-05-21 15:10)
- 8. PolicyLab Studying Effect of Weather, Social Distancing on Local COVID-19 Spread. PolicyLab at the Children’s Hospital of Philadelphia Research Institute; 21-April-2020 link (Accessed 2020-05-21 15:15)
- 9. Forecasting the Impacts of Weather and Social Distancing on COVID-19 Transmission Across the U.S. PolicyLab at the Children’s Hospital of Philadelphia Research Institute; link (Accessed 2020-05-21 15:20)
- 10. Walle T. The Unacast Social Distancing Scoreboard - Methodology. Unacast; link (Accessed 2020-05-16 21:00)
- 11. Unwin HJT, Mishra∗2 S, Bradley VC, et al. Report 23: State-level tracking of COVID-19 in the United States. Imperial College COVID-19 Response Team; 21-May-2020 link; DOI: 10.25561/79231
- 12. Influenza Infectious Dose May Explain the High Mortality of the Second and Third Wave of 1918–1919 Influenza Pandemic. PLoS One; link (Accessed 2020-05-21 15:20)
- 13. Infection fatality rate of SARS-CoV-2 infection in a German community with a super-spreading event. Cold Spring Harbor Laboratory Press; 18-May-2020 link; DOI: 10.1101/2020.05.04.20090076
Related
Rebekah Jones managed the Florida COVID-19 dashboard until she tried to add a feature to show which counties comply with the reopening criteria. Now you can see what got her fired.
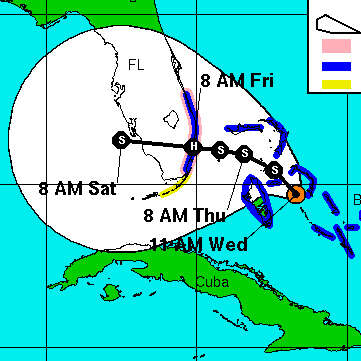
Don’t treat the center line of the IHME forecast charts as a precise prediction, any more than you would assume that a hurricane will follow the center line on the NHC hurricane forecast cone images. The forecast is a wide range, not a specific number.


